
Technicians focus on price levels because there is information about investor behavior and risk appetite contained within prices.
My friend Jonathan Krinsky (MKM Partners) isn’t convinced that the ferocious bounce we saw in the US stock market represents the final bounce before this correction has run its course. He points to deterioration in uptrends elsewhere in the world, Europe for example, as well as the break down of internals (advancing stocks vs declining stocks) beneath the surface of the S&P 500 / NYSE composite.
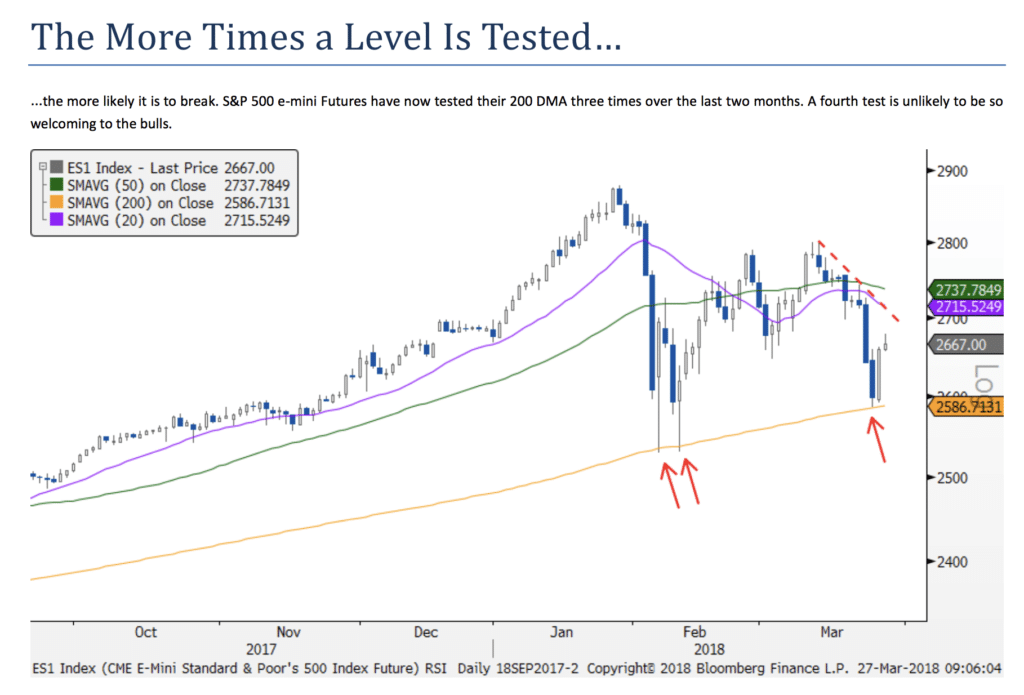
And the testing of the lows – we’ve had three of them in the futures market since the volatility began in February. Will another test be as successful?
As far as levels, there is strong resistance for the SPX in the 2700-2740 range. There is obvious support down at the 200 DMA (2586), however, Friday was the second test of the 200 DMA after the February correction, and the third if we use S&P 500 Futures. A third, and fourth, test will likely not be so welcoming to the bulls.
And his chart:
Josh here – should we test this support level again, can the buyers be relied upon to come back in? The market’s overall psychology could change rapidly if not. You don’t have to believe in these levels, by the way – but you should know that enough money is paying attention to them that it doesn’t really matter what you personally choose to believe in.
Source:
Don’t Call it a Comeback
MKM Partners – March 27th, 2018


[…] Technicians focus on price levels because there is information about investor behavior and risk appetite contained within prices. My friend Jonathan Krinsky (MKM Partners) isn’t convinced that the ferocious bounce we saw in the US stock market represents the final bounce before this correction has run its course. He points to deterioration in uptrends elsewhere in the world, Europe for example, as well as the break … Source: http://thereformedbroker.com/2018/03/27/chart-o-the-day-testing-the-lows-again/ […]
… [Trackback]
[…] Here you can find 78371 additional Info on that Topic: thereformedbroker.com/2018/03/27/chart-o-the-day-testing-the-lows-again/ […]
… [Trackback]
[…] Here you will find 68336 additional Information to that Topic: thereformedbroker.com/2018/03/27/chart-o-the-day-testing-the-lows-again/ […]
… [Trackback]
[…] Info on that Topic: thereformedbroker.com/2018/03/27/chart-o-the-day-testing-the-lows-again/ […]
… [Trackback]
[…] Read More Info here on that Topic: thereformedbroker.com/2018/03/27/chart-o-the-day-testing-the-lows-again/ […]
… [Trackback]
[…] Info to that Topic: thereformedbroker.com/2018/03/27/chart-o-the-day-testing-the-lows-again/ […]
… [Trackback]
[…] Find More on to that Topic: thereformedbroker.com/2018/03/27/chart-o-the-day-testing-the-lows-again/ […]
… [Trackback]
[…] Read More here to that Topic: thereformedbroker.com/2018/03/27/chart-o-the-day-testing-the-lows-again/ […]