This astounding chart comes to us from HSBC’s The Nomadic Investor report.
It shows that, basically, ETF flows, foreign capital flight and US corporate buybacks fueled the entirety of the 7-year bull market!
Here you go (emphasis mine):
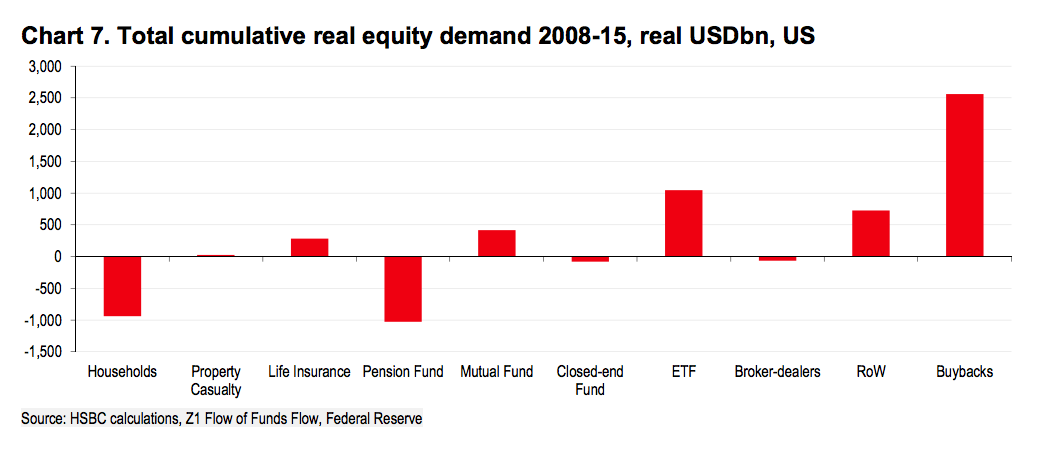
It is difficult for us to see in this data the direct wealth effect of the Fed’s QE programme. Yes, lower US Treasury yields did feed into lower US corporate yields and thus contributed to incentivising US corporates to issue bonds and buy back their own shares with the proceeds, but that’s about it. Cumulative traditional US equity demand, i.e. demand from US households, pension funds, insurance companies, mutual funds and the like, is more or less unchanged between 2008-the end of 2014. In fact, between 2010 and 2013, traditional equity players net sold US equities despite QE being in full swing. A further breakdown of traditional equity demand among the major players (see Chart 7 below) shows that if it was not for ETF flows (and to some extent, foreign buying), the period 2008-15 would have registered a net negative traditional equity demand.
So now you know where to send the ‘thank you’ card.
As for US-based households and pension funds – they’re net sellers the whole way up! (other than ETF purchases, I suppose)
Here’s HSBC’s Anton Tonev and Davey Jose:
Households have sold about USD1trn net of US equities (in real terms). However, 2013 and 2014 were two consecutive years of net positive household US equity demand – something that had not happened since the early 1950s…
…The other big equity outflow since the financial crisis in 2008 has been from US pension funds – also around USD1trn. Pension funds have had seven consecutive years of equity outflows.
Better hope the buybacks continue, gang. Not sure who’s coming in to take up that slack.
Source:
The Nomadic Investor: Beware a slowdown in US share buybacks HSBC – March 2016
I’m a New York City-based financial advisor at Ritholtz Wealth Management LLC. I help people invest and manage portfolios for them. For disclosure information please see here.
Get a Full Investor Curriculum: Join The Book List
Every month you'll receive 3-4 book suggestions--chosen by hand from more than 1,000 books. You'll also receive an extensive curriculum (books, articles, papers, videos) in PDF form right away.


… [Trackback]
[…] Find More on to that Topic: thereformedbroker.com/2016/03/08/one-astounding-chart-explains-the-entire-7-year-bull-market/ […]
… [Trackback]
[…] Read More here to that Topic: thereformedbroker.com/2016/03/08/one-astounding-chart-explains-the-entire-7-year-bull-market/ […]
… [Trackback]
[…] Information on that Topic: thereformedbroker.com/2016/03/08/one-astounding-chart-explains-the-entire-7-year-bull-market/ […]
… [Trackback]
[…] Find More on that Topic: thereformedbroker.com/2016/03/08/one-astounding-chart-explains-the-entire-7-year-bull-market/ […]