My pal JC Parets is nice with the charts. One of his favorite setups, from a trading perspective, is the false move. “From false moves come fast moves” is the applicable aphorism and it can work very well in both directions – false breakouts and false breakdowns. The mechanics behind this are simple – in a false move, the majority of the market is leaning the wrong way and price finds a level at which there are no more sellers (or buyers). The reaction can be swift and violent as everyone discovers, en masse, that they really weren’t that bullish (or bearish) after all.
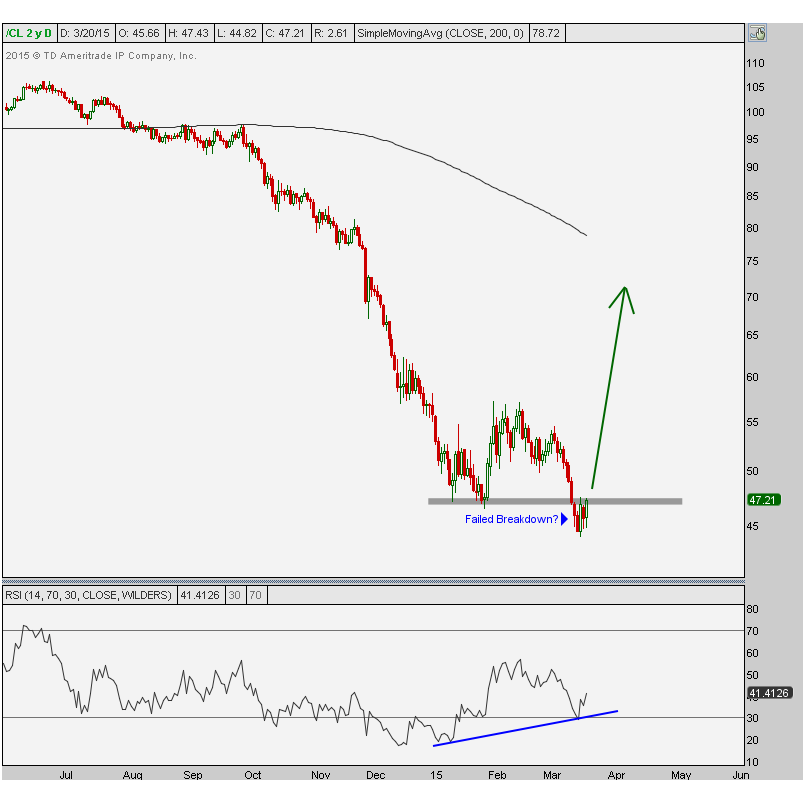
Here’s a look at crude oil, which JC says could be setting up for a false breakdown. He notes the momentum divergence as relative strength (RSI) puts in a higher low and does not confirm the new lows in price:
Over the past couple of weeks Crude Oil prices have rolled over and are hitting levels not seen since early 2009, right around the time that the epic 200% rally first got going. I use a 14-day RSI as my momentum indicator and on these new lows in price, RSI is putting in a higher low. Here’s what it looks like:

Read more below:
Crude Oil To $70 In the Second Quarter? (All Star Charts)


… [Trackback]
[…] Find More Info here to that Topic: thereformedbroker.com/2015/03/21/a-false-breakdown-in-crude-oil/ […]
… [Trackback]
[…] Information on that Topic: thereformedbroker.com/2015/03/21/a-false-breakdown-in-crude-oil/ […]
… [Trackback]
[…] Information to that Topic: thereformedbroker.com/2015/03/21/a-false-breakdown-in-crude-oil/ […]
… [Trackback]
[…] Information to that Topic: thereformedbroker.com/2015/03/21/a-false-breakdown-in-crude-oil/ […]