Chart o’ the Day: Can the Market Handle Falling Earnings?

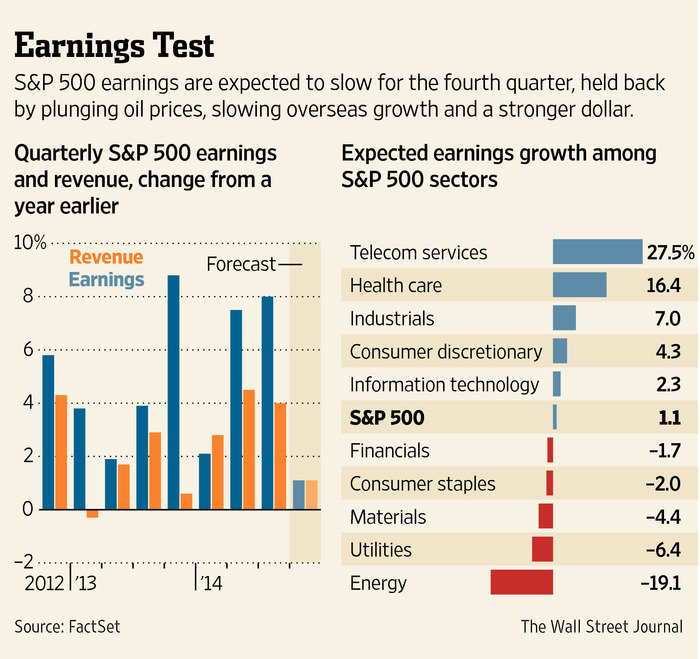
Earnings season is almost upon us and, for the first time in a long time, the increase in corporate profits we’ve grown accustomed to will likely not be there. Thanks to falling oil and the strengthening dollar, the S&P 500 is now only expected to notch a 1.1% year-over-year gain as companies report their Q4 numbers to The Street. Five of the S&P 500’s ten sectors are expected to show negative growth.

Here’s the Wall Street Journal’s infographic on current expectations:

earnings

A few things to consider:

1. We’ve had earnings growth soft patches before – notably in 2010 and 2011 and, while it did lead to heightened volatility, it didn’t derail the primary trend.

2. The bigger question is whether or not consumer spending can make up for the drop in earnings from bank net interest margins and energy-related capex spending, both of which may suck in the first half of 2014 given oil prices and rates.

3. Will buybacks continue along and absorb some shocks along the way as they have in past? If estimates continue to see negative revisions, will it matter so long as share counts continue to decrease?

4. On the surface, the slowdown looks nasty, but according to Factset via WSJ, most of the weakness can be attributed to the energy sector, where earnings are expected to be down 19%. Ex-energy stocks, the S&P 500 should still show earnings growth of 3.5% according to current consensus. Not the end of the world.

Some food for thought.

Source:

This content, which contains security-related opinions and/or information, is provided for informational purposes only and should not be relied upon in any manner as professional advice, or an endorsement of any practices, products or services. There can be no guarantees or assurances that the views expressed here will be applicable for any particular facts or circumstances, and should not be relied upon in any manner. You should consult your own advisers as to legal, business, tax, and other related matters concerning any investment.

The commentary in this “post” (including any related blog, podcasts, videos, and social media) reflects the personal opinions, viewpoints, and analyses of the Ritholtz Wealth Management employees providing such comments, and should not be regarded the views of Ritholtz Wealth Management LLC. or its respective affiliates or as a description of advisory services provided by Ritholtz Wealth Management or performance returns of any Ritholtz Wealth Management Investments client.

References to any securities or digital assets, or performance data, are for illustrative purposes only and do not constitute an investment recommendation or offer to provide investment advisory services. Charts and graphs provided within are for informational purposes solely and should not be relied upon when making any investment decision. Past performance is not indicative of future results. The content speaks only as of the date indicated. Any projections, estimates, forecasts, targets, prospects, and/or opinions expressed in these materials are subject to change without notice and may differ or be contrary to opinions expressed by others.

Wealthcast Media, an affiliate of Ritholtz Wealth Management, receives payment from various entities for advertisements in affiliated podcasts, blogs and emails. Inclusion of such advertisements does not constitute or imply endorsement, sponsorship or recommendation thereof, or any affiliation therewith, by the Content Creator or by Ritholtz Wealth Management or any of its employees. Investments in securities involve the risk of loss. For additional advertisement disclaimers see here: https://www.ritholtzwealth.com/advertising-disclaimers

Please see disclosures here.

What's been said:

Discussions found on the web
  1. omega seamaster replica commented on Jan 28

    … [Trackback]

    […] Information to that Topic: thereformedbroker.com/2015/01/12/chart-o-the-day-can-the-market-handle-falling-earnings/ […]