Jon Krinsky’s technical note for MKM Partners this week is entitled “The Game Has Changed… V-Shaped Bottom Unlikely” and, while not bearish, he is very skeptical that last week’s low will be the low for the current correction. He notes that breadth was terrible despite Friday’s bounce and that we’ve now spent a week below the 200-day moving average – which hasn’t happened since the current rally began in 2012.
Jon looks at the longer-term picture in the chart below, pointing out that the longer-term moving averages are beginning to set up as they had at prior market tops. This is a trend that bears watching, in my view…
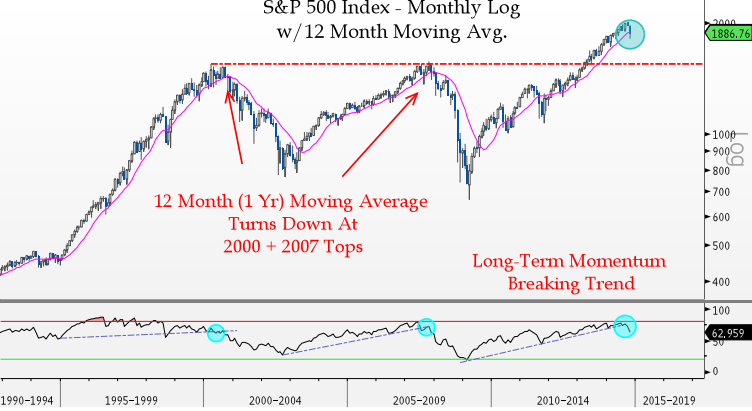
One way we have been viewing the long-term trend and momentum of the SPX is by using a 12 month, or 1 year, moving average. This long-term moving average has generally been rising since the fall of 2009. There have been several months where price closed beneath it, namely the August – December 2011 period, but for the most part price has remained above for the majority of the bull market. While October is not over, price is in danger of closing below the 12-month moving average for the first time in nearly three years.
Closing below the 12-month M.A. does not necessarily mean the end to the bull market, but if you look back at the tops in 2000 and 2007, both started with price closing below the 12-month moving average. The slop of that average then began to flatten out, and ultimately turned down. Should that occur, it would be much more significant when talking about the long-term.
Jon’s chart:
Source:
The Game Has Changed… V-Shaped Bottom Unlikely MKM Partners – October 19th 2014
[…] There you can find 82336 additional Info on that Topic: thereformedbroker.com/2014/10/20/chart-o-the-day-a-look-at-the-12-month-moving-average/ […]
[…] There you can find 66403 additional Information on that Topic: thereformedbroker.com/2014/10/20/chart-o-the-day-a-look-at-the-12-month-moving-average/ […]
I’m a New York City-based financial advisor at Ritholtz Wealth Management LLC. I help people invest and manage portfolios for them. For disclosure information please see here.
Get a Full Investor Curriculum: Join The Book List
Every month you'll receive 3-4 book suggestions--chosen by hand from more than 1,000 books. You'll also receive an extensive curriculum (books, articles, papers, videos) in PDF form right away.


.
áëàãîäàðþ.
… [Trackback]
[…] Find More on that Topic: thereformedbroker.com/2014/10/20/chart-o-the-day-a-look-at-the-12-month-moving-average/ […]
… [Trackback]
[…] Find More on on that Topic: thereformedbroker.com/2014/10/20/chart-o-the-day-a-look-at-the-12-month-moving-average/ […]
… [Trackback]
[…] Find More here on that Topic: thereformedbroker.com/2014/10/20/chart-o-the-day-a-look-at-the-12-month-moving-average/ […]
… [Trackback]
[…] Find More on to that Topic: thereformedbroker.com/2014/10/20/chart-o-the-day-a-look-at-the-12-month-moving-average/ […]
… [Trackback]
[…] There you can find 82336 additional Info on that Topic: thereformedbroker.com/2014/10/20/chart-o-the-day-a-look-at-the-12-month-moving-average/ […]
… [Trackback]
[…] Info on that Topic: thereformedbroker.com/2014/10/20/chart-o-the-day-a-look-at-the-12-month-moving-average/ […]
… [Trackback]
[…] Find More Information here on that Topic: thereformedbroker.com/2014/10/20/chart-o-the-day-a-look-at-the-12-month-moving-average/ […]
… [Trackback]
[…] Read More to that Topic: thereformedbroker.com/2014/10/20/chart-o-the-day-a-look-at-the-12-month-moving-average/ […]
… [Trackback]
[…] There you can find 66403 additional Information on that Topic: thereformedbroker.com/2014/10/20/chart-o-the-day-a-look-at-the-12-month-moving-average/ […]
… [Trackback]
[…] Read More on on that Topic: thereformedbroker.com/2014/10/20/chart-o-the-day-a-look-at-the-12-month-moving-average/ […]