
The most controversial topic in the entire investment industry over the last few years has been whether or not the CAPE Ratio has any practical use whatsoever from a real-world investing standpoint. My opinion, which I will argue below, is that it does (or it can) have a use, but with loads of caveats and limitations that render it significantly less reliable than perhaps it had been in the past.
Some very well-respected and influential asset managers (and the advisors who follow them) have suffered massive underperformance (and even losses) since the recovery began, owing in large part to an inability to get past their devotion to this singular measure of stock market valuation. Some of them have built their entire investment philosophies around it and have dug themselves in rather deeply.
Over the last few months, there’s been a radical rethinking of the utility of CAPE and a huge battle has been taking place in the financial blogosphere as a result, sucking in nearly every thought leader and serious investment writer in the process. Jesse Livermore, a pseudonymous blogger writing at Philosophical Economics, has really blown the debate wide open, beginning with what I consider to be one of the most notable financial blogposts of 2013 (see Fixing the Shiller CAPE from December 13th).
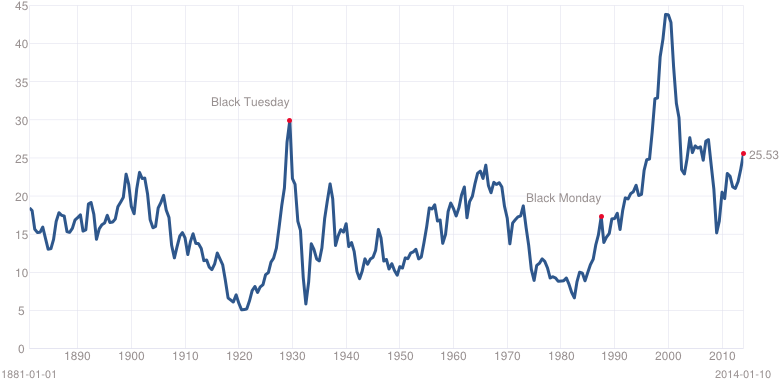
For the uninitiated, CAPE stands for Cyclically Adjusted Price to Earnings and it is usually applied by taking the earnings average of the last ten years rather than the typical PE ratio we see employed, which uses a year’s worth of data (last year’s or next year’s). The current CAPE Ratio for the S&P 500 stands at just over 25, above the long-term average in the mid-teens but nowhere near the impossible heights of 1999, which were closer to 45 (see chart below, via Multpl).
Professor Robert Shiller’s concept behind his creation was that by smoothing out the normal economic cycle of recessions and expansions, we could arrive at a “true” picture of a stock market’s earnings and, by extension, come up with a normalized benchmark against which to judge their valuation. It was a brilliant idea and quickly found adherents both in academia and on The Street.
CAPE does have some utility in terms of gauging the forward returns of a stock market, specifically it’s been shown to be effective over-ten year horizons (at times). But as a timing tool it is as close to useless as an indicator can get and still be called an indicator.
Consider that the US stock market has spent more than 95% of the last quarter of a century above the level that CAPE would say is expensive relative to long-term historical valuations. In that time, the S&P has increased by more than 450%, from 330 in 1990 to over 1840 today. To say that a total market increase of this magnitude, and over this length of time, all occurred within the context of what one would term a historically “overvalued” condition simply means that this tool’s definition of “overvalued” is, in and of itself, incorrect.
Now at this point, the kneejerk reaction from religious devotees to this heuristic will be a mocking or sarcastic intonation that “This time it’s different,” usually delivered with a self-satisfied sneer that says “You’ll see!”
To which my response has been that, no, it’s not different this time. It’s different every time.
I have trouble with the idea that someone using 100 years of stock market data is somehow doing science or physics. Markets are not mechanistic systems, rather they are biological, comprised as they are of millions of human beings, not nuts and bolts or electrons and neutrons. We’ve only got three examples of a secular bear market and possibly we’re at the end of a fourth. Go show a sample size of four to an actual scientist. And then explain how, when the data was first collected, the entire public market was made up of railroad stocks, see what the response is. The notion that somehow the millions of variables from different economic eras are ever similar enough to be shoehorned into an equation is tough to accept – even while I concede that having some empirical framework is better than none at all. I certainly don’t a better mousetrap to suggest!
And so my argument is not that the CAPE Ratio is useless – in fact, quite the opposite; it is among the best measures of long-term valuation mankind has yet devised for the complex adaptive system that is the stock market. Unfortunately, it is just that – a long-term and laggard measure of valuation, one of many, that doesn’t even come close to explaining what might come next. From a timing standpoint, it is not merely useless, but dangerously so. Adherents of CAPE were telling anyone who would listen that US equities were as much as 40% overvalued as of July 2009, some 8000 thousand Dow Jones points ago.
Not only is it not predictive in the short-term, it is also incapable of incorporating the evolution in some of the most fundamental influencers on stock prices and then recalibrating itself accordingly – which means that its ability to make even long-term predictions is in doubt as well.
For example, changes in GAAP accounting have meant drastic differences in the way stock options are expensed and in the way that earnings losses are accounted for when acquisitions fail or assets become impaired. There are also cash-on-the-balance-sheet issues to be aware of, as well as the effects of dividend and stock repurchase plans. There are distinct changes in the way that profits are reported and that earnings are generated that come about as a result of legislation. These variables completely change the profitability regime from one decade to another. Jeremy Siegel is perhaps the most well-known proponent of this particular view (see Don’t Put Your Faith in CAPE Crusaders from last September).
In addition, there are discrepancies even in the way the various data series themselves are collected and organized. There are changes in methodology along the way and different formats or information providers, virtually assuring inconsistencies even if we could all agree on where to place the goalposts to begin with (we cannot).
There are also societal changes that impact the level of stock ownership across the nation, things like the advent of the 401(k) and the mass-proliferation of stock-based compensation. Today, some 30% of household net worth is invested in stocks, stock funds or other such vehicles. This is double the levels of forty years ago, in 1974 it was more like 15%. Today, 60% of US households currently participate in the stock market in some way, shape of form – a significantly higher percentage than in generations past. Given this fact, is it any wonder that valuations have trended higher thanks to a larger pool of participants? Or should we ignore that entirely?
Then there are structural changes like the mix of companies contained in a given index. There are very few companies in the S&P 500 that comprised the original index when it was created in 1957. And there are entirely new industries that have sprung up that hadn’t existed years ago – software, semiconductors, mobile telephony and the like. These new industries carry with them inherently higher profit margins that, to the unionized industrial behemoths of the 20th century, would’ve seemed impossible. My friend Justin Golden notes that Facebook has 5,000 employees generating $7 billion in revenues and it’s got a market value of $140 billion – triple that of General Motors, which employs 200,000 people. In the late 1970’s heyday of GM, it employed 600,000 workers and generated $63 billion in sales. Why anyone believes that measures of profitability from one era to another are in any way comparable – or that mean reversion will automatically kick in at some point to smash them back together – is inconceivable.
The Technology sector is almost twenty percent of the S&P 500, one fifth, and the stocks it’s comprised of are exponentially more profitable than former leadership groups in the index. Software companies in the S&P carry net margins north of 20% while consumer staples (food, tobacco, beverages) companies sport margins of under 3%! For energy stocks it’s closer to 10% and for industrial goods manufacturers it’s 7%. And people are surprised that corporate profit margins have been high and trending higher since the advent of the web in the mid-1990’s. Where is the mystery?
Interest rates also play a role in the upward tilt of valuations in stocks, which is yet another reason why CAPE should not be looked at in a vacuum. As Michael Rawson, CFA, discovers, “Since 1946, when the real 10-year Treasury rate has been between 1% and 4%, the average CAPE has been 20.87…The current inflation rate of about 1.20% and the 10-year Treasury rate of around 3.00% translate into a real rate of about 1.80%, suggesting that it is not unreasonable for the CAPE to be above its long-term average.” When allocation decisions are made between asset classes, prevailing interest rates are always and indisputably one of the primary considerations. Or shall we ignore this as well, for the sake of fitting reality to our rigid models?
In addition, even if you believe that CAPE is the best way to gauge the next decade’s worth of returns for the stock market, it is important to keep in mind that mean projected returns are just that – an average of a whole range of possible outcomes. This past summer, Cliff Asness of AQR calculated what the forward 10-year returns for stocks had been when the Shiller Cape had been in the 20’s as it is today. Asness found that when CAPE was between 21.1 and 25.1 the real return averaged just 0.9% and when it was above 25.1 the real return for the ensuing decade was closer to 0.5%. But not so fast, responded Larry Swedroe of Buckingham Asset Management, because “you shouldn’t treat the mean as the only possible outcome. For example, when the P/E 10 was between 21.1 and 25.1, the best 10-year real return was 8.3, and the worst was -4.4 percent. When the P/E 10 was above 25.1, the best 10-year real return was 6.3 percent, just 0.5 percent below the historical average, and the worst was now -6.1 percent.” In other words, while starting valuations matter, almost anything can still happen.
Lastly, there are changes in investor preference, also thanks to legislation – in this case changes to the tax code. As we’ve explained here on the site, “Prior to 2003 dividends were taxed at ordinary income levels, so for the highest two or three brackets fixed income was as valuable as the dividend at the same yield. Today, at the same yield, dividends are far more attractive since fixed income is taxed at a higher rate for the upper brackets. Additionally, prior to 1982, capital gains taxes were generally higher (as were the dividend tax rates because marginal tax rates were much higher).” Given this preferential treatment of equities by the IRS, why wouldn’t the CAPE Ratio be elevated for an extended period of time (as it has been).
The bottom line is that there are a host of reasons for why cyclically adjusting PE ratios makes sense to get a better perspective on the valuation of stocks relative to history. But beyond that, to construct a bubble narrative or even short the market as a result of this formula – without even pausing to consider all of what it doesn’t encompass – is just plain old bad investing.
Before wrapping up, I want to make perfectly clear that the above does not constitute a “stocks are cheap” argument, we are talking about process here and not predictions. I am of a piece with Jesse’s conclusion on the topic: Stocks are overextended but do not require a crash to offer solid entry points. I’ll let the man explain in his own words:
It follows that if you’re patiently waiting for 10% equity returns to be offered to you right now, you’re either waiting for some kind of crisis that puts investors in an irrational state of mind (the state of mind they’ve been working off since Lehman), or you’re waiting for a significant Fed tightening–not to 2005-type levels, but to pre-1995-type levels. In my opinion, you’re waiting for Godot.
With that said, the current market is heavily overextended, with increasingly lopsided sentiment. In terms of monetary policy, we’re at a potential turning point, where improving growth may force the Fed to shift from “ridiculously easy” to just “easy”, and where many market participants will wrongly extrapolate to the next step: “tight.” As the market digests the changes, it would hardly be surprising to see a 5%to 10% correction occur. In my estimation, the current market would be very willing to finally throw the bears a lifeline, and embark on such a correction, in the presence of an appropriate catalyst (which it can’t currently seem to find). If a 10% correction were to occur, the 10 year equity return would rise by around 100 bps. The extra return might be worth waiting for.
Investors should treat CAPE measures the same way they do any other indicator: as one tool of many and about as inconsistently reliable as the rest of them.
The world changes and it doesn’t demonstrate any regard for the rules and sureties of yesterday in the process.
***
If you’re interested in the heavy mathematical lifting behind what I’ve laid out above, please visit the many embedded links as well as Jesse Livermore’s two posts on the topic linked below (in the second one he answers the critics of his initial salvo). You can also check out Meb Faber’s take, which is pithy and excellent as well:
Fixing the Shiller CAPE: Accounting, Dividends, and the Permanently High Plateau (Philosophical Economics)
The Shiller CAPE: Addressing the Responses (Philosophical Economics)
CAPE Fear (Mebane Faber Research)


… [Trackback]
[…] Find More here to that Topic: thereformedbroker.com/2014/01/12/leaving-cape-town/ […]
… [Trackback]
[…] There you can find 95233 more Info to that Topic: thereformedbroker.com/2014/01/12/leaving-cape-town/ […]