Where are Wall Street’s analysts raising estimates and where are they cutting them? Are we seeing more upward or downward expectations?
Bank of America Merrill Lynch’s Quant Strategy Group keeps an earnings revision ratio (ERR) to track this stuff – in particular, the three-month rolling average is notable.
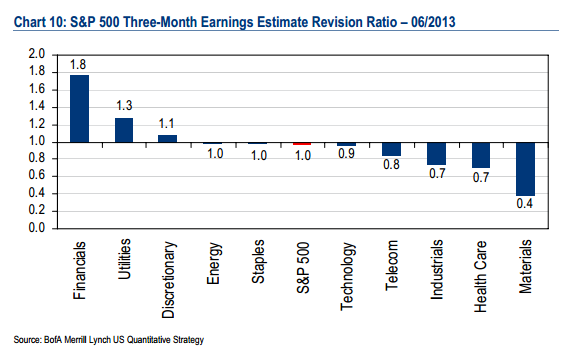
Here’s where analysts have raising and cutting over the last 90 days, by sector:
Financials and the two Consumer sectors
have 3-month revision ratios above one,
indicating more positive than negative
revisions. Materials, Health Care and
Industrials have the lowest revision
ratios.

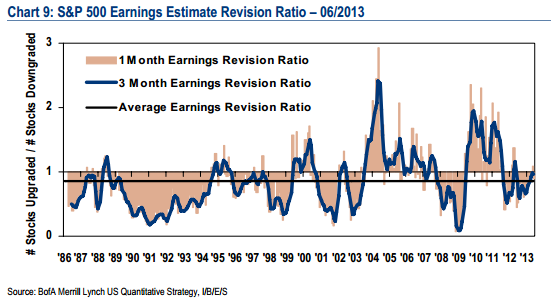
Below is how the S&P looks as a whole – you’ll note that overly optimistic revision ratios tend to coincide with major market tops:
The 3-month earnings revision ratio
ticked down slightly in June to 0.97 from
0.99, following 5 consecutive months of
improvement. The ratio indicates analysts
are taking up as many estimates as they
are taking down, above the ratio’s longterm average. The one-month ratio,
which can be more volatile, ticked down
to 0.9 from 1.1.

Josh here – Analysts have grown more optimistic in their revisions over the last few months. The ratio of upward to downward revisions is a good gauge as to whether or not they are letting expectations get ahead of the reality.
So far, they have not.
Source:
BAML


… [Trackback]
[…] Read More here to that Topic: thereformedbroker.com/2013/07/09/wall-streets-earnings-revisions/ […]
… [Trackback]
[…] Information to that Topic: thereformedbroker.com/2013/07/09/wall-streets-earnings-revisions/ […]
… [Trackback]
[…] Find More Information here on that Topic: thereformedbroker.com/2013/07/09/wall-streets-earnings-revisions/ […]
… [Trackback]
[…] Read More here on that Topic: thereformedbroker.com/2013/07/09/wall-streets-earnings-revisions/ […]
… [Trackback]
[…] Read More to that Topic: thereformedbroker.com/2013/07/09/wall-streets-earnings-revisions/ […]