Chart o’ the Day: Can We Break the Cycle in 2013?

Every year so far, post-Credit Crisis, we’ve played the same game this time of year – economic momentum slows down, fears from Europe resume and the US stock market takes a nasty tumble.

In 2010, 2011 and 2012, the US stock market peaked during one of the four weeks of April.  A correction of between 10 and 19% ensued.

The number one question on everyone’s mind right now (ours included) is whether or not this spring will be yet another Risk Off Extravaganza.

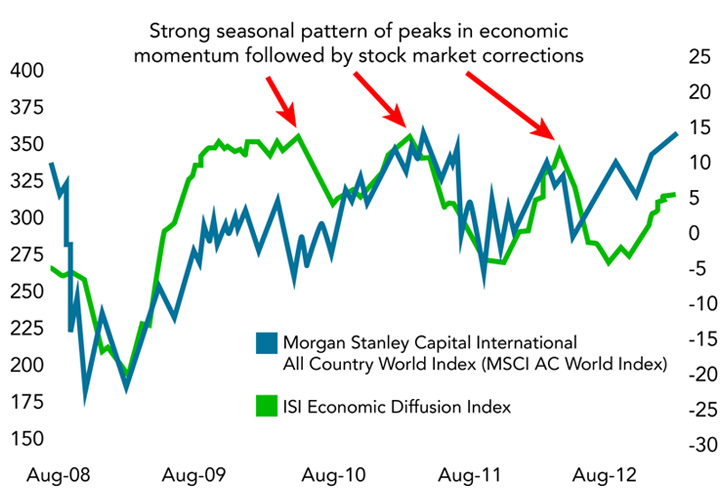
Here’s Jurrien Timmer, co-manager of the Fidelity Global Strategies Fund with his new chart on the topic:

  • In 2010 it was the end of QE1 and the beginning of the eurozone debt crisis that led to a 17% correction in the S&P 500 from the April high to the July low (based on intraday extremes).
  • In 2011 it started as an inflation shock (in terms of food and energy prices) caused by the combination of QE2 and an overheating China, which was ultimately compounded by the debt ceiling fiasco, policy tightening in China, and a further unraveling of the debt crisis in Europe. The market peaked in May and fell 21% until it bottomed in early October.
  • In 2012 it was the growth recession in China combined with yet another flareup in Europe, this time brought on by the Greek elections. The S&P 500 peaked in April and fell 11% to its low in June.
sell in may

Source:

Breakout or Fakeout (Fidelity)

This content, which contains security-related opinions and/or information, is provided for informational purposes only and should not be relied upon in any manner as professional advice, or an endorsement of any practices, products or services. There can be no guarantees or assurances that the views expressed here will be applicable for any particular facts or circumstances, and should not be relied upon in any manner. You should consult your own advisers as to legal, business, tax, and other related matters concerning any investment.

The commentary in this “post” (including any related blog, podcasts, videos, and social media) reflects the personal opinions, viewpoints, and analyses of the Ritholtz Wealth Management employees providing such comments, and should not be regarded the views of Ritholtz Wealth Management LLC. or its respective affiliates or as a description of advisory services provided by Ritholtz Wealth Management or performance returns of any Ritholtz Wealth Management Investments client.

References to any securities or digital assets, or performance data, are for illustrative purposes only and do not constitute an investment recommendation or offer to provide investment advisory services. Charts and graphs provided within are for informational purposes solely and should not be relied upon when making any investment decision. Past performance is not indicative of future results. The content speaks only as of the date indicated. Any projections, estimates, forecasts, targets, prospects, and/or opinions expressed in these materials are subject to change without notice and may differ or be contrary to opinions expressed by others.

Wealthcast Media, an affiliate of Ritholtz Wealth Management, receives payment from various entities for advertisements in affiliated podcasts, blogs and emails. Inclusion of such advertisements does not constitute or imply endorsement, sponsorship or recommendation thereof, or any affiliation therewith, by the Content Creator or by Ritholtz Wealth Management or any of its employees. Investments in securities involve the risk of loss. For additional advertisement disclaimers see here: https://www.ritholtzwealth.com/advertising-disclaimers

Please see disclosures here.

What's been said:

Discussions found on the web
  1. imitation watches for sale commented on Sep 18

    … [Trackback]

    […] There you can find 70207 more Information on that Topic: thereformedbroker.com/2013/03/27/chart-o-the-day-can-we-break-the-cycle-in-2013/ […]

  2. Bitcoin Loophole Review commented on Sep 22

    … [Trackback]

    […] Information on that Topic: thereformedbroker.com/2013/03/27/chart-o-the-day-can-we-break-the-cycle-in-2013/ […]

  3. bitcoin evolution online commented on Oct 03

    … [Trackback]

    […] There you will find 4442 additional Info to that Topic: thereformedbroker.com/2013/03/27/chart-o-the-day-can-we-break-the-cycle-in-2013/ […]

  4. Sex commented on Oct 29

    … [Trackback]

    […] Read More on to that Topic: thereformedbroker.com/2013/03/27/chart-o-the-day-can-we-break-the-cycle-in-2013/ […]

  5. td canada trust login easyweb commented on Nov 06

    … [Trackback]

    […] Find More on on that Topic: thereformedbroker.com/2013/03/27/chart-o-the-day-can-we-break-the-cycle-in-2013/ […]

  6. Community News commented on Dec 11

    … [Trackback]

    […] Information to that Topic: thereformedbroker.com/2013/03/27/chart-o-the-day-can-we-break-the-cycle-in-2013/ […]

  7. mơ thấy bướm phụ nữ commented on Jan 06

    … [Trackback]

    […] Find More on that Topic: thereformedbroker.com/2013/03/27/chart-o-the-day-can-we-break-the-cycle-in-2013/ […]

  8. Sharp CD-XP120WR manuals commented on Jan 20

    … [Trackback]

    […] Information on that Topic: thereformedbroker.com/2013/03/27/chart-o-the-day-can-we-break-the-cycle-in-2013/ […]

  9. mt5-fr.website/ commented on Jan 22

    … [Trackback]

    […] Find More Information here to that Topic: thereformedbroker.com/2013/03/27/chart-o-the-day-can-we-break-the-cycle-in-2013/ […]