Jeffrey Kleintop is the chief market strategist at LPL Financial. I frequently cite his work here because I respect the fact that he is not averse to raising cash or getting more aggressive as the situation calls for it. I also think it’s cool that he is not afraid to engage in the realm of financial social media, a tough crowd if ever there was one.
Anyway, Jeff’s got an interesting note out on how the different S&P sectors are affected by the potential outcomes of the election and the market’s perception of how the race is going. Check this out:
***
While there are many “man on the street” polls, what matters most to investors is what is priced in on Wall Street rather than what people are saying on Main Street. A stock market based “election poll” is useful in that it highlights what the market is pricing in about the outcome of the election that is more refined than merely looking at the overall market.
Based upon these legislation-sensitive industries, we have created two indexes to help us track the markets’ implied forecast of the election outcome reflected in the performance of these industries. Each index is composed of an equal weighting among seven industries that combined total about 100 S&P 500 stocks.
Table1: S&P 500 Industries Likely to React More Favorably to One Party
| Republicans | Democrats |
| S&P 500 Coal & Consumable Fuels | S&P 500 Health Care Facilities |
| S&P 500 Diversified Financial Services | S&P 500 Food & Staples Retailing |
| S&P 500 Oil & Gas Exploration & Production | S&P 500 Gas Utilities |
| S&P 500 Oil & Gas Drilling | S&P 500 Health Care Services |
| S&P 500 Managed Health Care | S&P 500 Life Sciences Tools & Services |
| S&P 500 Electric Utilities | S&P 500 Construction Materials |
| S&P 500 Specialty Retail | S&P 500 Homebuilding |
X
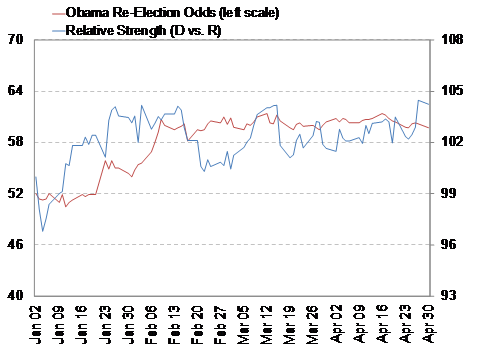
To track what the market has priced in for the Democrats’ odds of retaining the White House and Senate we have taken the Democrats index and divided it by the Republicans index. An upward sloping line suggests the market may be pricing in a rising likelihood of the Democrats retaining the White House and their majority in the Senate, while a downward sloping line suggests improving prospects for the Republicans. While other factors may influence the relative performance of these indexes, as time goes on the election consequences may become paramount as investors increasingly vote with their money. As you can see in Chart 2, already this year Obama’s re-election odds on Intrade.com are generally tracking the relative strength of our Democrat vs. Republican indexes.

Source: LPL Financial, Intrade.com, FactSet Research Systems
***
They plan to continue to keep the index updated as we get through the season.
Follow Jeffrey Kleintop on Twitter


… [Trackback]
[…] Read More here to that Topic: thereformedbroker.com/2012/05/10/jeff-kleintops-election-poll-index/ […]
… [Trackback]
[…] Here you can find 13236 more Information to that Topic: thereformedbroker.com/2012/05/10/jeff-kleintops-election-poll-index/ […]
… [Trackback]
[…] There you can find 27480 additional Info to that Topic: thereformedbroker.com/2012/05/10/jeff-kleintops-election-poll-index/ […]
… [Trackback]
[…] Read More on to that Topic: thereformedbroker.com/2012/05/10/jeff-kleintops-election-poll-index/ […]
… [Trackback]
[…] Read More Information here to that Topic: thereformedbroker.com/2012/05/10/jeff-kleintops-election-poll-index/ […]
… [Trackback]
[…] Info on that Topic: thereformedbroker.com/2012/05/10/jeff-kleintops-election-poll-index/ […]
… [Trackback]
[…] There you will find 91172 more Info on that Topic: thereformedbroker.com/2012/05/10/jeff-kleintops-election-poll-index/ […]
… [Trackback]
[…] There you can find 78757 more Info on that Topic: thereformedbroker.com/2012/05/10/jeff-kleintops-election-poll-index/ […]
… [Trackback]
[…] Read More Information here on that Topic: thereformedbroker.com/2012/05/10/jeff-kleintops-election-poll-index/ […]
… [Trackback]
[…] Find More Information here to that Topic: thereformedbroker.com/2012/05/10/jeff-kleintops-election-poll-index/ […]