Lots of people talking about what the Chart of the Year might be that best personifies 2015 from an investor’s perspective. I could show you the fact that the yield on the 10-year Treasury is flat from January 1st despite all the interest rate hike obsession, but that would be no fun. I could also show you the dollar vs commodities, but you’ve seen that quite a bit, I’m sure.
Instead, I’ve put together what I think is an even more meaningful chart to depict what it was like investing during 2015.
The median stock in the Russell 3000 is down 5% and there are some industry groups of stocks in which a full-blown bear market is now underway. The averages illustrating flat returns for US stocks this year are lying if you own a portfolio of individual names. If you own the S&P 500, you were bailed out by a handful of giant companies that masked the pain beneath the surface.
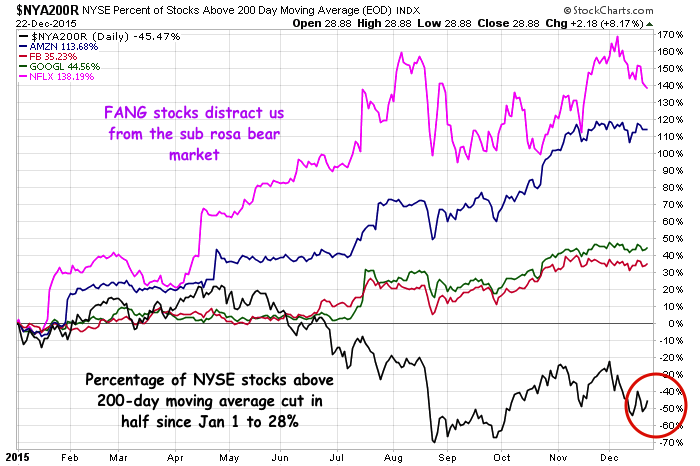
Below, I’m showing you the percentage of NYSE stocks above their 200-day moving average (representing an intermediate-term uptrend) in black. You can see that the amount of stocks above this uptrend gauge has been cut in half from the start of the year. At present, just 28% of all NYSE names are in uptrends, or less than 1 in 3 stocks. That’s not a bull market.
For contrast, I’ve plotted the year-to-date percentage gains of the FANG stocks that have served as the shiny baubles distracting everyone from the new sub rosa bear that’s taken hold of the market. It’s a fairly remarkable dichotomy by historical standards.
Narrowing bull market leadership is not great for sentiment and it sends all the wrong messages to investors and corporate leaders about how they should be allocating for the future. What usually follows next is the growing hordes of laggard stocks continues to grow as, one by one, the leaders succumb and fall. I’ve heard it remarked that this cycle is very different from those in the past (it’s elongated thanks to extraordinary monetary policy) so things could easily go the other way.
[…] His chart above shows the paltry percentage of NYSE stocks above their 200-day moving averages, contrasted with the 2015 gains by the so-called FANG stocks — market darlings Facebook FB, -0.83% , Amazon AMZN, +0.08% , Netflix NFLX, +1.65% and Google GOOG, +0.04% GOOGL, +0.18% (the last now known as Alphabet). “It’s a fairly remarkable dichotomy by historical standards,” Brown says. Go read his full post here. […]
I’m a New York City-based financial advisor at Ritholtz Wealth Management LLC. I help people invest and manage portfolios for them. For disclosure information please see here.
Subscribe & Reform
Get a Full Investor Curriculum: Join The Book List
Every month you'll receive 3-4 book suggestions--chosen by hand from more than 1,000 books. You'll also receive an extensive curriculum (books, articles, papers, videos) in PDF form right away.


[…] My Chart of the Year, Hands Down (The Reformed Broker) […]
[…] His chart above shows the paltry percentage of NYSE stocks above their 200-day moving averages, contrasted with the 2015 gains by the so-called FANG stocks — market darlings Facebook FB, -0.83% , Amazon AMZN, +0.08% , Netflix NFLX, +1.65% and Google GOOG, +0.04% GOOGL, +0.18% (the last now known as Alphabet). “It’s a fairly remarkable dichotomy by historical standards,” Brown says. Go read his full post here. […]
[…] 5. FANG (Facebook, Amazon, Netflix, Google) ‘Trumped’ everything except Trump. This really is the one chart that summed up US markets. […]
[…] Facebook, Apple, Netflix, and Google, for concealing 2015’s “sub rosa bear […]
[…] Facebook, Apple, Netflix, and Google, for concealing 2015’s “sub rosa bear […]
[…] Facebook, Apple, Netflix, and Google, for concealing 2015’s “sub rosa bear […]
[…] Facebook, Apple, Netflix, and Google, for concealing 2015’s “sub rosa bear […]
[…] Facebook, Apple, Netflix, and Google, for concealing 2015’s “sub rosa bear […]
[…] Facebook, Apple, Netflix, and Google, for concealing 2015’s “sub rosa bear […]
[…] Facebook, Apple, Netflix, and Google, for concealing 2015’s “sub rosa bear […]
[…] Facebook, Apple, Netflix, and Google, for concealing 2015’s “sub rosa bear […]
[…] Facebook, Apple, Netflix, and Google, for concealing 2015’s “sub rosa bear […]
[…] Facebook, Apple, Netflix, and Google, for concealing 2015’s “sub rosa bear […]
[…] Facebook, Apple, Netflix, and Google, for concealing 2015’s “sub rosa bear […]
[…] Cacebook, Apple, Ietflix, and Moogle, for concealing 2015’s “sub rosa bear […]