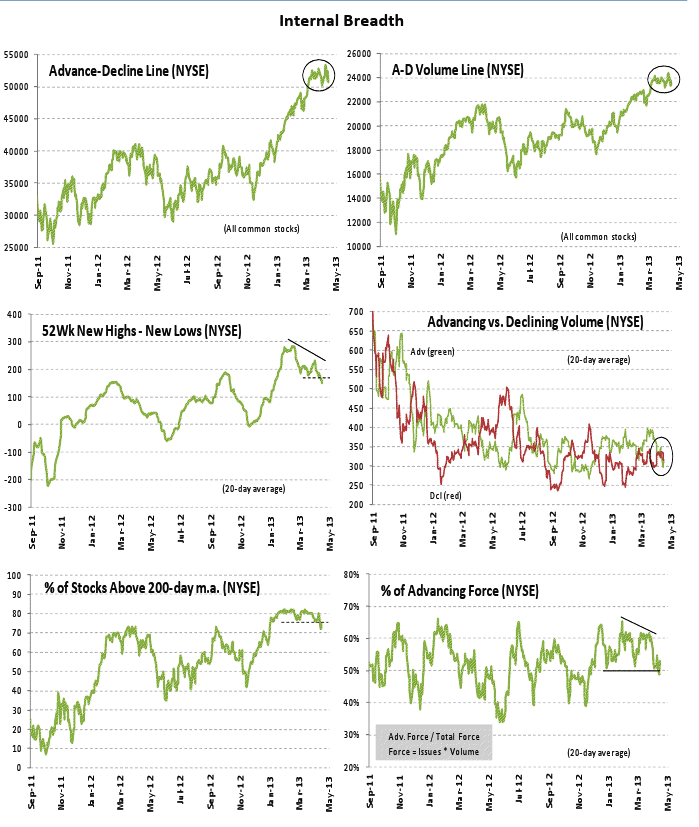
My friend Ari H. Wald, CFA, CMT, and Technical Strategist at PrinceRidge, has been pretty money on the major trends so far this year. In this week’s note, the technician points out some major yellow lights in the internals. Overall, he thinks the market can settle back in to the uptrending 200-day and then resume the advance. We’re a ways above that level, however, and Ari is recommending caution. He sees momentum picking up to the downside, a higher number of stocks for sale and other divergences within the internals.
The intro to his full notes below along with a few charts that really illustrate his point well.
Hope you enjoy – Josh
***
S&P 500 Trend is Shifting Sideways to Lower; Intra‐Sector Trading Ideas
Key Points
- Expect a sideways trend to ultimately resolve lower.
- S&P 500’s 200‐day m.a. (~1450) is key support.
- Distribution days and inflecting momentum are concerns. Selling bounce attempts.

Investment Takeaway: Distribution days on April 15th and 17th along with a break of momentum suggests that the market’s supply/demand balance is shifting and the S&P 500 is entering a period of consolidation, in our view. We expect the index to continue to chop sideways before ultimately resetting to its 200‐day m.a., currently trending higher at 1450. We plan to use bounce attempts in the coming weeks as a tactical opportunity to transition to a Corrective outlook. Given our current Neutral view and defensive portfolio positioning we do not believe an outlook change is necessary today.
This week’s concerns are twofold. First, NYSE declining issues outpaced those advancing by a 35:1 margin on Monday (April 15th) and by 11:1 on Wednesday (April 17th), marking two of the biggest distribution days since November 2011. Declining/advancing volume was also 15:1 and 11:1, respectively. This is indicative of conviction on behalf of sellers, and is especially troubling because it followed an inability for the S&P 500 to sustain a new all‐time high above 1575.

Second, this recent dip has also generated a definitive downward inflection in weekly momentum (Momentum has been moved to Bearish from Mixed in our Scorecard this week). The index’s weekly RSI, for instance, has fallen to its lowest level since January and has likely peaked for the current rally. Currently 62, a reflex bounce in this measure between 65‐70 would be a signal to sell, and the next strong buy point in the S&P 500 may not develop until this momentum tool resets to the 40‐45 range.
***
If Ari is right, this might be a good time to chill out a bit on new longs and start making a list of the things you want to come in lower.
Source:


… [Trackback]
[…] Find More on that Topic: thereformedbroker.com/2013/04/18/ari-wald-this-is-what-distribution-looks-like/ […]
… [Trackback]
[…] Find More Info here on that Topic: thereformedbroker.com/2013/04/18/ari-wald-this-is-what-distribution-looks-like/ […]
… [Trackback]
[…] Find More on that Topic: thereformedbroker.com/2013/04/18/ari-wald-this-is-what-distribution-looks-like/ […]
… [Trackback]
[…] Info to that Topic: thereformedbroker.com/2013/04/18/ari-wald-this-is-what-distribution-looks-like/ […]
… [Trackback]
[…] Find More on on that Topic: thereformedbroker.com/2013/04/18/ari-wald-this-is-what-distribution-looks-like/ […]
… [Trackback]
[…] There you can find 65447 additional Information to that Topic: thereformedbroker.com/2013/04/18/ari-wald-this-is-what-distribution-looks-like/ […]
… [Trackback]
[…] Find More here to that Topic: thereformedbroker.com/2013/04/18/ari-wald-this-is-what-distribution-looks-like/ […]
… [Trackback]
[…] There you will find 66652 additional Information on that Topic: thereformedbroker.com/2013/04/18/ari-wald-this-is-what-distribution-looks-like/ […]
… [Trackback]
[…] Info on that Topic: thereformedbroker.com/2013/04/18/ari-wald-this-is-what-distribution-looks-like/ […]
… [Trackback]
[…] Info to that Topic: thereformedbroker.com/2013/04/18/ari-wald-this-is-what-distribution-looks-like/ […]