A friendly reminder – long-term investing is similar to being the pilot for a commercial airline: Lots of calmness and regularity punctuated by the occasional “OH MY F***ING GOD!” moment.
And in those moments, both successful long-term investors and pilots will remind themselves of what the procedures are and how they are supposed to react – as well as how they’re not supposed to react.
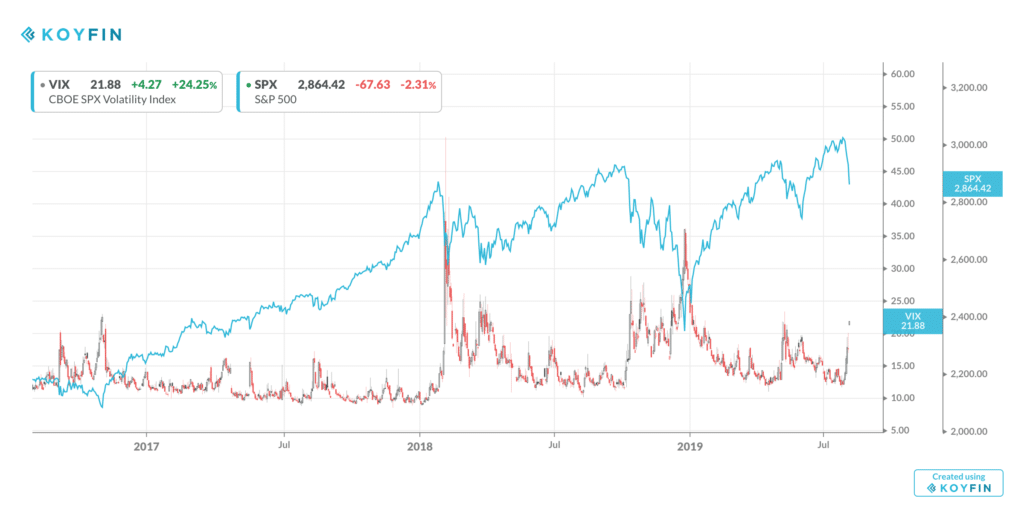
I thought I’d pop this Vix (Volatility Index in red) vs SPX (S&P 500, price only, in blue) chart to remind you of what this sort of thing looks like in practice…

One thing you ought to notice right off the bat is that vol normalizes and finds its original level shortly after one of these bouts of activity. The S&P, however, does not. It trends back upward and establishes new highs. They are inversely correlated but the “performance” of these two indices is in no way symmetrical.
I’d also remind you that these bouts can last much longer than what the chart is depicting from the last three years. Steel your nerves accordingly if you plan to stick around.
Now read these two things:
The pessimism first…
China just ‘all but abandoned hopes for a trade deal with the US,’ economist says (Business Insider)
Now the realism:


writing dissertation prospectus https://dissertations-writing.org/
dissertation paper https://helpon-doctoral-dissertations.net/