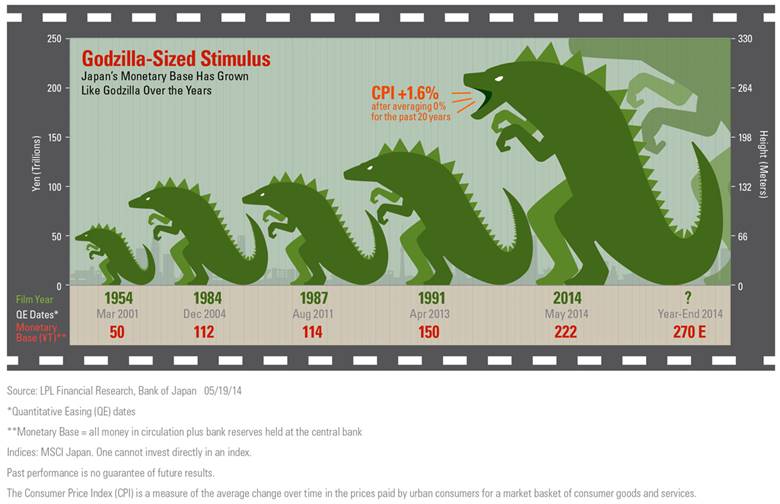
My favorite thing in the world today is Jeffrey Kleintop’s chart depicting the sheer magnitude of Japan’s stimulus program…

The first round of QE in Japan took place over a four-year period, starting March 2001 and ending December 2004, and grew the monetary base from 66 trillion yen to 112 trillion. The second round came in 2010 and 2011, but the monetary base did not materially expand again until April 2013, when the current program was implemented. With the monetary base at 150 trillion yen, the Bank of Japan (BOJ) announced that it would expand the program aggressively. Now, about a year after it began, it has grown to 222 trillion yen.
To put the amount of QE Japan is doing in perspective, we can look at it relative to the United States. The U.S. Federal Reserve has tapered its QE program from $85 a month to $45 billion a month this year, but at the full $85 per month QE was running about $1 trillion per year. While the BOJ’s QE has a dollar equivalent of roughly $70 billion per month, its economy is only about one-third that of the U.S. economy. As a result, Japan’s QE relative to the size of the economy would be the United States equivalent of a staggering $2.2 trillion per year. The same program is targeted to grow the monetary base to 270 trillion yen by the end of 2014.
Source:
Japan Going Godzilla
Jeffrey Kleintop, Chief Market Strategist for LPL Financial – May 19th 2014


… [Trackback]
[…] Read More on to that Topic: thereformedbroker.com/2014/05/20/chart-o-the-day-japans-godzilla-stimulus/ […]