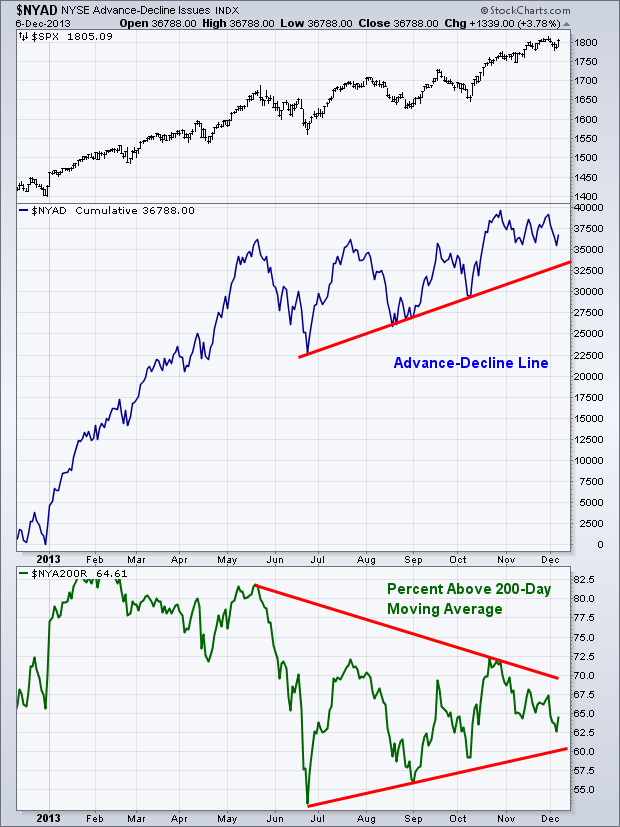
It’s no secret that I’m a big fan of advance/decline, new highs vs new lows and other internals to get a read on how markets are acting beneath the surface of the indices. It’s not that this information is always actionable (at least not for me), it’s that it often offers clues as to market mood and can signal “regime change” from bullish to bearish attitudes.
Andrew Thrasher has been doing these great weekly technical rundowns that are worth checking out at his blog each Monday morning. Here’s something he posted about breadth and stocks trading above the 200-day moving average that might give you a new data point to keep an eye on:
Equity Breadth
Last week we did not see much improvement in breadth, which is to be expected with the weakness we saw in the equity market for the bulk of trading.
The bottom panel of the chart below shows the percentage of stocks above their 200-day moving average. This measure of market breadth has garnered quite a bit of attention over the last few months. While the negative divergence is important to point out, the percentage itself is still north of 60%.
I reference 60% because that’s the level it was unable to get back above at the 2007 high. We saw the percentage of stocks above their 200-day moving average drop for nearly eight months before a top was put in for the S&P 500 ($SPX) in ’07. While we are presently approaching the same duration of deterioration, the percentage itself still shows the bulk of stocks in theoretical up trends (above their long-term MA). A break of 60% would also end the trend of making higher lows for the percentage above 200MA, and that’s when I think it’ll be time to start getting concerned. So while this metric of market breadth is worrisome, it’s not yet to levels I feel trigger a red flag.

Check out Andrew’s full post here:


… [Trackback]
[…] Information to that Topic: thereformedbroker.com/2013/12/10/andrew-thrasher-on-market-breadth/ […]