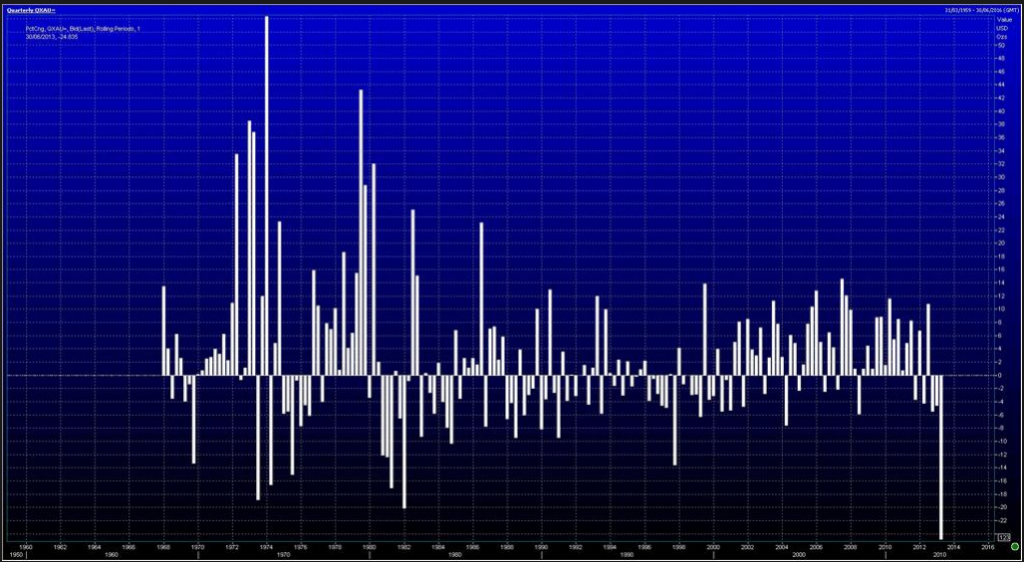
Jamie McGeever of Reuters put this chart out which illustrates just how bad this quarter has been for gold. It’s off 25% in the last three months – the worst quarter for the precious metal in 45 years! The spot gold data he’s working with only goes back to the 1960’s but on Reuters TV he mentioned that this actually may qualify as the worst quarter since the 1920’s.
When I saw this I did a double-take. My best guess – and not one I’m acting on – is that there’s a $100 + rally brewing for gold in the near future…but from 1200 or from 1000? That’s the tricky part!
Check this out:

Here’s Bloomberg with even more data:
Gold dropped to a 34-month low in New York and headed for the worst quarterly slump on record following the Federal Reserve’s comments on tapering stimulus.
Gold futures slid 25 percent this quarter, heading for the biggest loss since at least 1975, withLondon prices set for the largest fall since at least 1920. Fed Chairman Ben S. Bernanke said June 19 that the Fed may slow its bond-buying program this year. U.S. data may show today that consumer sentiment improved and business activity expanded, economists said.
Bullion slipped 28 percent this year, set for the biggest annual drop since 1981, after rallying the past 12 years. About $62.5 billion was wiped from the value of precious metals exchange-traded product holdings this year as some investors lost faith in them as a store of value.
Follow @ReutersJamie on Twitter


… [Trackback]
[…] Find More on that Topic: thereformedbroker.com/2013/06/28/chart-o-the-day-golds-worst-quarter-in-half-a-century/ […]
… [Trackback]
[…] Find More to that Topic: thereformedbroker.com/2013/06/28/chart-o-the-day-golds-worst-quarter-in-half-a-century/ […]