
The Relative Strength Index or RSI is typically expressed as a 14-day reading to determine the degree to which a stock or an index is overbought or oversold, if at all. It was created in 1978 by J. Welles Wilder Jr. (here’s the book) who was a mechanical engineer by trade before turning his mathematical mind to stock and commodity trading, subsequently developing some of the most widely traded tools in technical analysis today.
A good rule of thumb is to think about stocks with an RSI of 30 or under as being “oversold”, meaning traders have rapidly been pushing down the price rapidly and meaningfully with their sales. On the upside, a stock with an RSI of 70 or greater can be typically thought of as “overbought.” Stocks can remain oversold or overbought for a long time, so it’s not a magic formula for trading profits.
Successful traders use RSI to give context to a move a stock is making or they’ll look at it in tandem with other indicators, for example, the primary trend of the stock’s price, which matters more. Some traders are using overbought or oversold signals as triggers to fade the crowd and go the other way. Snapbacks can be powerful. Other traders are using RSI as a form of secondary confirmation with respect to the overall trend in price. This latter group wants to see some sort of divergence, for example a stock continuing to fall in price while RSI stops falling, which could be a prelude to a bounce.
Today I want to look at the Relative Strength Index for Apple as the share price has fallen quite a bit recently – maybe too far, too fast.
Apple is the biggest stock in the world. It’s statistically oversold here, having gapped below its 50-day moving average after a good not great earnings report this summer. Pay particular attention to the bottom pane, which is 14-day RSI. You’ll note that buyers have been rewarded for stepping in each time the stock has been oversold to this degree over the last five years – oftentimes that reward has been immediate.
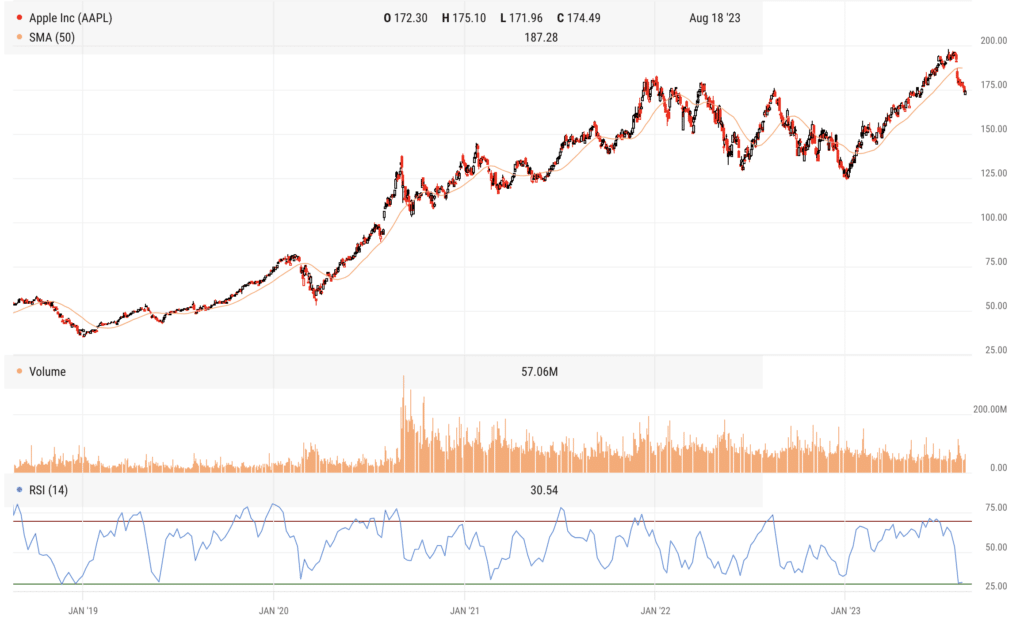
If you’re looking at the stock for a buying opportunity, what you’ll want to watch for now is a bullish swing rejection. Very simply – on Apple’s next bounce, RSI should break back above 30 into “positive territory. That’s step one. Step two is to observe during the stock’s next pullback. If RSI can dip but remain above 30 (not get more oversold), it tells you the sellers in the stock have largely been cleaned up and bulls are back in control. Think of it like a higher low, but in the RSI, not just in the stock price.
Apple is still in a more intermediate-term uptrend regardless of its price action this summer. It’s well above the 200-day moving average and that moving average is still rising (below):
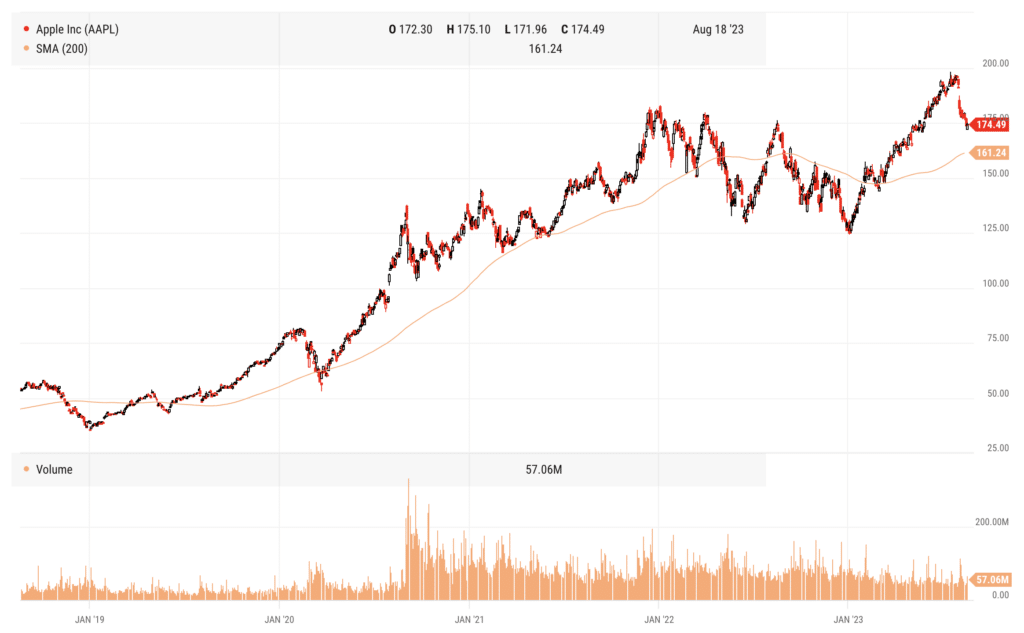
My personal opinion is that Apple should have bounced forcefully off that 175 level, which was the prior resistance dating back to January 2022. It didn’t (at least not yet). This rising 200-day moving average below may the next big test. I don’t love this set-up, despite how oversold it is here.
Looking ahead, we’ve got the release day event for the iPhone 15 on Tuesday, September 12th and then nothing until Q3 earnings on October 27th.
Apple will get some benefit of the new phone during the current quarter, maybe a week or two’s worth of sales if it’s available mid-September. After three straight quarters of negative revenue growth, this will be critical. They’re guiding to revenue growth for the quarter we’re in now, but we’re talking about 1% year over year (with sales of $90.2 billion expected).
I actually like the fundamental set-up here better than the technical one.
The last time Apple reported three straight quarters of negative revenue growth and then snapped that slowdown with a sales increase, it was 2015 into 2016. When sales troughed during the summer of that year, the stock was once again off to the races.
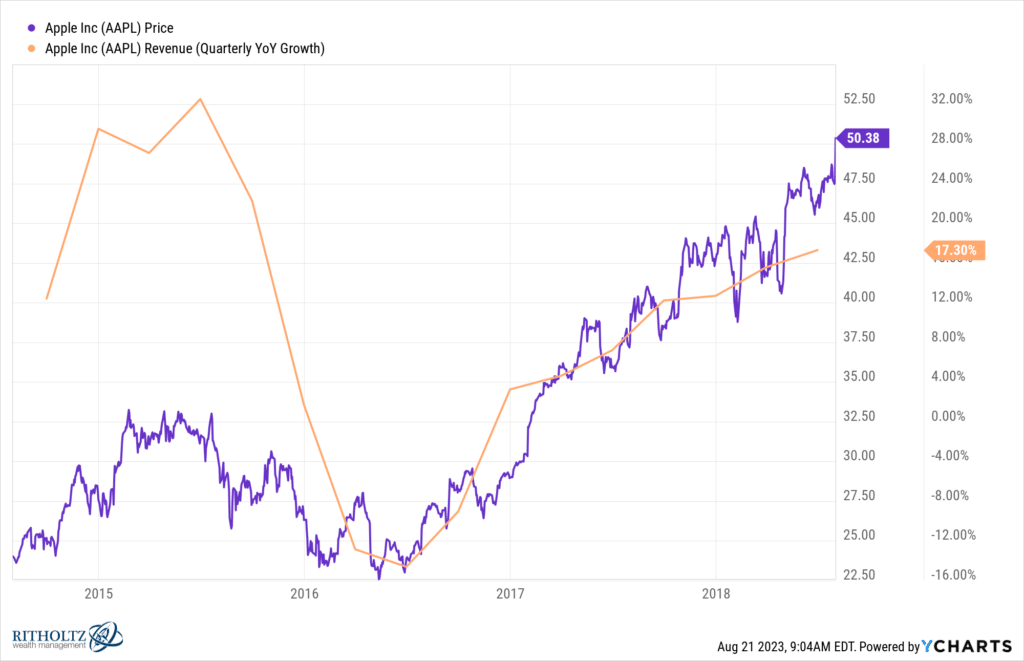
It’s not only the biggest stock in the world, it’s also the best company in the world, maybe of all time. You’ve got a moment here where sales growth is slipping and the stock is as oversold as its been in years. The best case scenario for buyers of the stock today is that sales reaccelerate and the new phone is an instant, apparent hit. The technicals will tell you whether or not the rest of your fellow market participants are willing to make that bet. Watch price, watch RSI, watch the test of the 200-day moving average to find out.


