
Every bear market has these two things in common:
- They end
- Expected returns go up
The first thing is self-explanatory. The second thing should be obvious but from my talks with thousands of investors over the years, I have found that it is most certainly not intuitive to most people.
When I tell you that expected returns are rising as stock prices fall, this is an overly simplistic way of saying that investors only get paid for what stocks might do in the future. We get nothing for what stocks have already done in the past. And history tells us that as stock prices get lower, both in absolute terms and relative to their valuations, the opportunities to make money prospectively increase. It feels as though the opposite is true – losses can make us believe additional losses are more likely, the presence of some risk puts us on high alert for the possibility of more risk. This is all baked into our human nature and it’s very hard to circumvent, even if we know the science and the chemistry of how it all works.
But, in truth, we also all know that buy low, sell high is the best strategy for investing in anything – stocks, real estate, bonds, etc. Buying low means taking less risk that the purchases we are making will be imprudent ones. Seth Klarman refers to this as a “margin of safety.” The investment may not appreciate in price, but the better of a valuation I can buy it for, the less risk I have that it will go substantially lower in price. So buying stocks when the prices are falling is both less risky and carries with it a higher probability of eventually making money.
Again, it will never feel that way in the moment, but it’s empirically true. You can argue with me, but I have centuries of data on my side and you would have absolutely no evidence whatsoever. You’d have your feelings, and that would be okay I guess, but you would lose. Not only lose the argument but actually lose money betting against what I am saying as well.
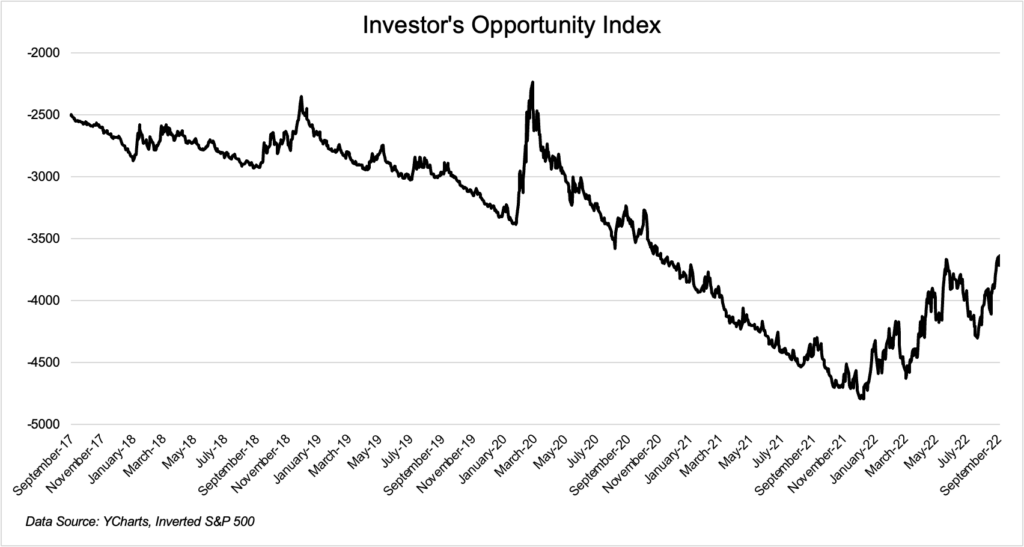
On Friday, the Investor Opportunity Index (IOI) hit levels we haven’t seen since September of 2020. In fact, it’s up 25% year-to-date.
What is the Investor Opportunity Index? It’s a thing I just made up last week. I asked Michael to run the inverse of the S&P 500 and create the below charts. What you are seeing is the opportunity for new dollars invested. That opportunity is going up. Rapidly.
In the first chart, the IOI is shown going back five years. We’re at a pretty good moment to put money to work in stocks with the IOI climbing fast.
In the second chart, the IOI year-to-date quoted in percentage terms. Yes, I know the stock market is down this year, but the Investor Opportunity Index is skyrocketing: 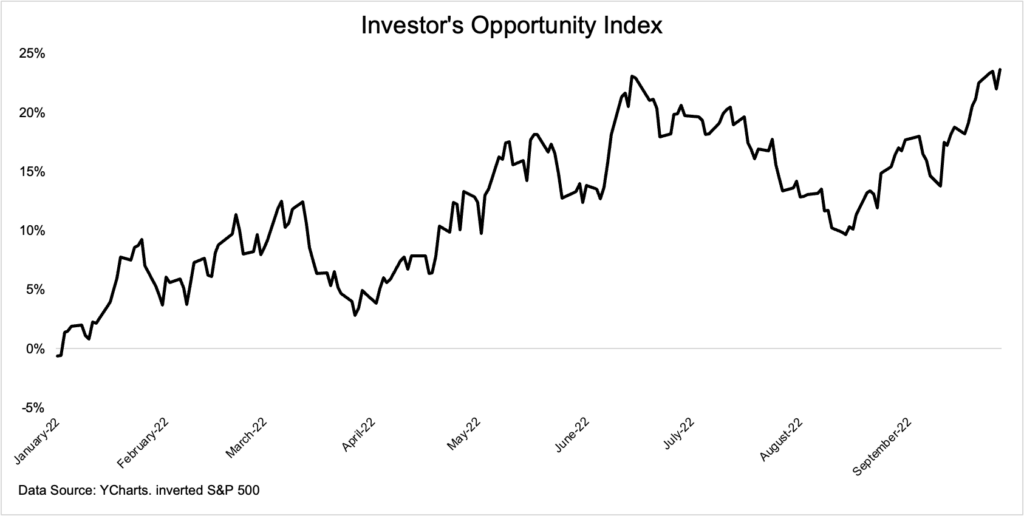
From now on, if you are under the age of 65 and know you have more money to put to work in your retirement and investment portfolio, I want you to think about the Investor Opportunity Index whenever you see the stock market selling off. Close your eyes and imagine the opportunity going up, up, up while the markets are going down, down, down.
Reorient your mindset toward the future while everyone around you reacts to the latest panic and pessimism of the present. It’ll keep you focused on the only thing that really matters: Expected returns and the rewards of tomorrow. You’ll thank me in a few years.


