
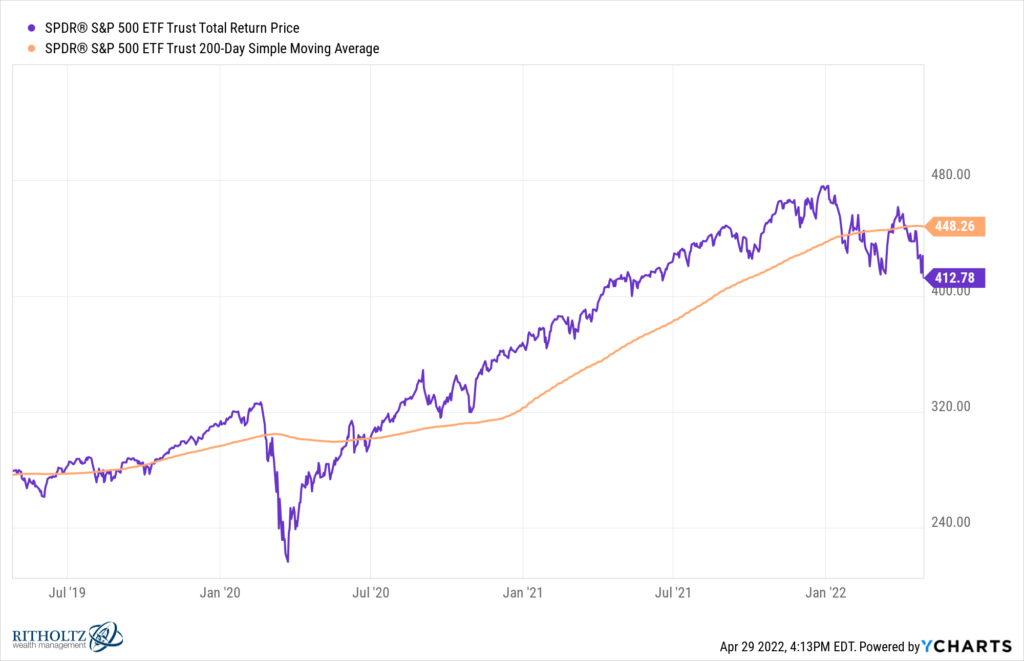
No oscillators, no internals, no RSI, no MACD, no fib levels. Strip it all and focus on one thing – price relative to average price over the last ten months.
The S&P 500 broke below its 200-day simple moving average at the beginning of March, spent the whole month rallying back, got above, failed, broke down again and now it’s a shitshow. We’re finishing the calendar month below the 200-day for the first time in two years.
What’s the significance of a clear downtrend for the S&P 500 and a monthly finish below this simple moving average? Well, higher volatility – in both directions – is going to become the new normal. We ran the numbers. The fifty best and worst one-day returns for the S&P 500 in stock market history – 47 of those 50 best and worst days have happened while the S&P 500 was below the 200-day.
This is where the drama takes place.
We talk about technicals and manage investment strategies based on technicals because technicals strip away a lot of the sort of commentary that doesn’t do you any good when the trend has changed. A lot of great stories have to be thrown away as the buying and selling invalidates them, one by one. Price becomes the only thing you can trust.
What does this mean for you? Tell me what your goals and timeframe are…that has to be the starting point. If you don’t know what you’re trying to achieve by putting money at risk in the market, then how can you know how a particular market move might affect you?
In ten years, none of this will matter. You will not even be able to see this episode on a chart. But we don’t live in increments of ten years. We live today and tomorrow. Today and tomorrow, if you’ve taken nothing off the table, this is going to hurt.
So what’s going to happen next? It’s less complicated than you think.
If history is any guide, and it always is because human nature never changes, you’re going to see spectacular green days – gaps higher where the sellers melt away and stocks look like they’ve seen the worst. You’ll also be seeing more days like this – gut-wrenching plunges with everything down, nowhere to hide and no sign of a bottom to be found. And this will continue for awhile, until the big up-days aren’t as extreme and the sell-offs start to lose their intensity. And then it comes to an end. A lot of damage will have been done, but a lot of potential opportunity will also have been created.
Who wins? The person who does the least.
The person who does the most always loses. Despondently bullish on Tuesday, hopeful on Wednesday, bearish again by Friday, buying on green, selling on red, mood changing with every day’s narrative, chopping yourself up at every twist and turn – this is how you can take a bad situation and make it ten times worse. I don’t recommend this sort of behavior. I’ve never seen it work.
Stocks have returned roughly 15% a year over the last decade. There’s a price that long-term investors have to pay for performance like that. You’re looking at it. Living through it. This is the price. If you’re willing to pay it in the short-term, one hundred years of stock market history say you’ll be rewarded in the long-term. Not everyone can. Not everyone will.
***
If you need help right now, we’re here.


[…] Source link […]
[…] Source link […]
[…] Source link […]
[…] Source link […]
[…] It’s Less Complicated Than You Think – The Reformed Broker Josh Brown explains that technicals help you tune out the noise…especially in this sort of market environment. […]
[…] Source link […]
[…] Source link […]
[…] Source link […]
[…] Source link […]
[…] Source link […]
[…] Source link […]
[…] Source link […]
[…] Less complicated than you think (TRB) […]
[…] Source link […]
[…] ‘It’s Less Complicated Than You Think’ – Josh Brown – The Reformed Bro… […]