
Josh here – you may have noticed a pattern over the past few years, especially pronounced in recent months. Stocks are getting hit the hardest right around the two days before options expiration and the day or two afterward. Options expiration occurs each month during the third Friday of that month. Options volumes have been explosive since the onset of the pandemic and the related retail trader deluge. These volumes are now so large that the dealer gamma hedging that takes place each month around expiration is having an undeniable effect on your portfolio (and, perhaps, your emotions!) although you probably aren’t aware of the cause.
There’s a financial advisor up in the Berkshires who has been investigating the role of options expiration (or OpEx) on the stock market. He’s asked me to publish this piece of research and explanation, which I gladly agreed to. He’s not looking for attention or accolades for having uncovered this, he just thinks it would be useful for investors (and their advisors) to be aware of. I’ve got his supporting research in Excel. He’s checked his own work multiple times. His findings are incredible: The S&P 500 is up a cumulative 39% since 2020 began. But If you only held stocks during the four days surrounding each month’s OpEx, your return would be NEGATIVE 23%. Excluding these four-day OpEx windows each month would have turned the market’s 39% gain into a gain of 79%! That’s extraordinary. Please read the below from the author – we’ll call him “Lee” – and consider the ramifications.
***
Don’t Forget to Check the OpEx Calendar
In the third week of February, the S&P 500 fell by more than 2% on Thursday and another 0.7% on Friday.(1)
Similarly, during the holiday-shortened third week of January 2022, the S&P 500 (as measured by SPY) declined by more than 1 percent each day from Tuesday through Friday, for a total weekly return of -5.75 percent (Jan. 18 trough Jan. 21).
During these episodes, most commentators and strategists have understandably talked about current and projected earnings, rising rates, geopolitical tension, inflation, and the ongoing economic impact of Omicron. These are all critically important factors in both short-term and long-term market trends.
However, one factor that seems to go mostly unmentioned is the potential impact of Options Expiration (OpEx) and the role of options dealers in daily price movements.
The data show a recent trend of declining market prices in the days surrounding OpEx, which happens on the third Friday of each calendar month. No telling whether this phenomenon will continue, but it is curious in the era of increased options trading.
Why Does Options Trading Matter?
It is well-documented that options trading has surged in recent years.(2,3) Retail investors love the huge potential gains in options. They might not love the huge potential losses, but they’re apparently willing to live with them.
The other side of the options trade is typically an options dealer. Dealers aren’t interested in taking directional risk in underlying positions. As a result, dealers are forced to hold positions in order to hedge away the risk associated with their open options positions.
This isn’t a primer on the inner workings of the options market, but the general idea is that dealer hedging has likely been a source of market stability. As OpEx approaches on the third Friday of every month, dealers can start to unwind their hedges. This theoretically removes the floor of stability and can trigger increased volatility, especially when open options positions are large. (4)
What is the Result?
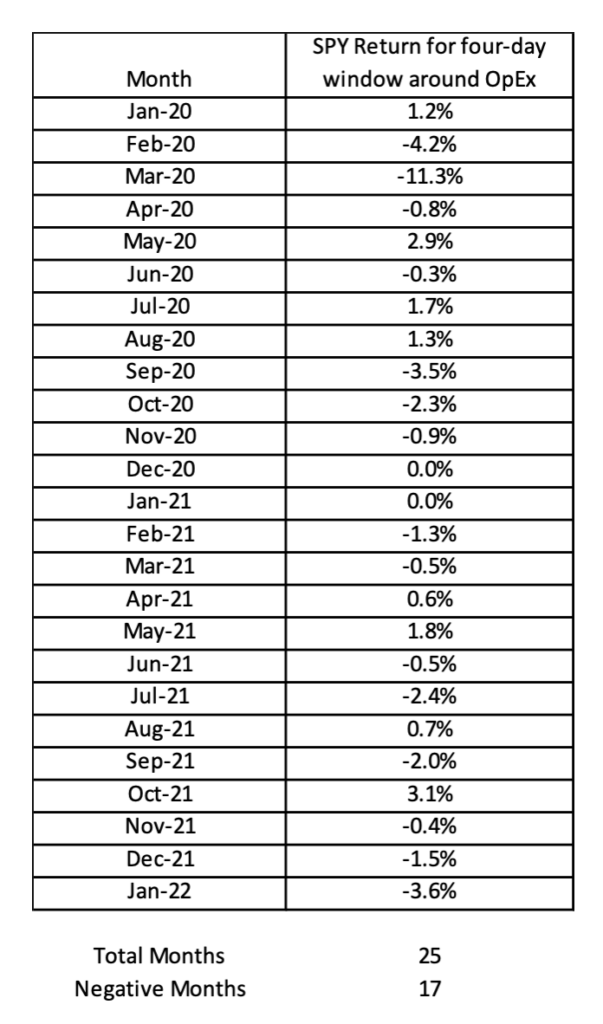
Looking back to the beginning of 2020, the impact of OpEx cannot be ignored. While there are always other factors impacting daily price moves, the general trend of markets falling around OpEx has been relatively persistent, as it was in January and February of this year. A simple analysis reveals the following result:
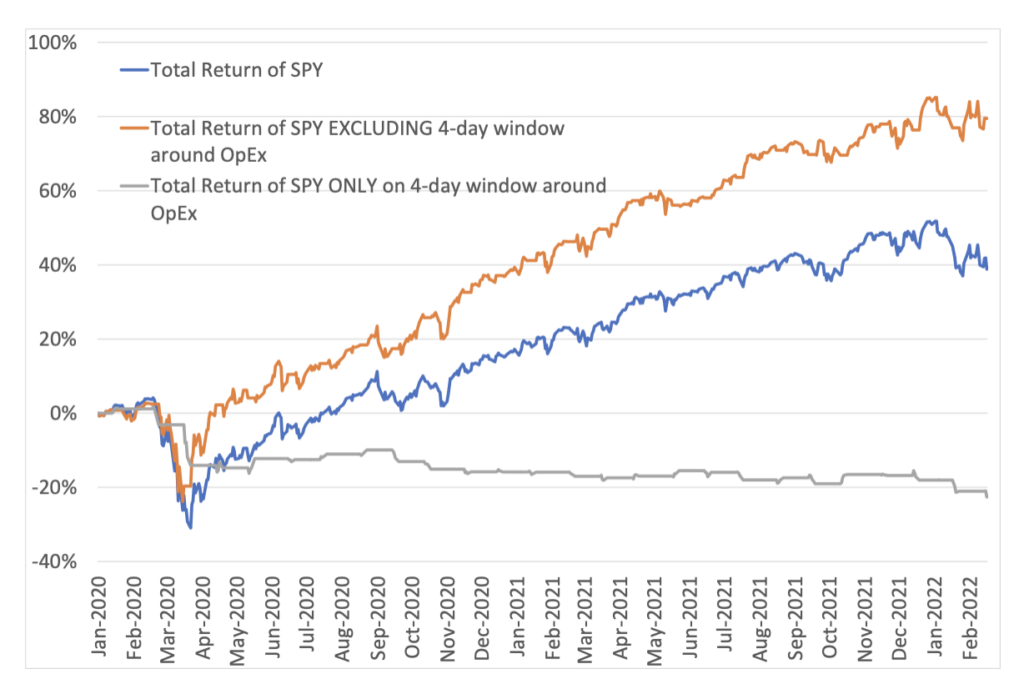
- Since the beginning of 2020, the total return on SPY is +39 percent.
- If we exclude the four-day trading window around OpEx (two days before OpEx through one day after OpEx), the total return of the SPY was +79 percent.
- If we look only at those four trading days each month, the total return of SPY is -23 percent.
The chart nearby shows a hypothetical portfolio of SPY if those four trading days were excluded every month or if those four trading days were the only exposure each month. The divergence in returns is remarkable.
Will this trend persist?
The return on SPY in the four-day trading window around OpEx has been negative in 18 times of the 26 months since the beginning of 2020 (assuming there is not a massive rally on Tuesday 2/22). It is remarkable that such a trend has been so consistent in an otherwise efficient market.
Bloomberg published a piece on the trend in September 2021, and yet the trend still seems to be generally in place. Market returns have been negative around OpEx in five of the subsequent six months.
It is impossible to predict whether the trend will continue. The factors that theoretically drive this trend seem to still be in place. Namely, options trading is popular, and options dealers are not in the business of taking directional risk. To the extent that these two things remain true, it is theoretically possible that the trend could continue.
This of course ignores all the other unpredictable factors that impact daily price moves. For example, if the Ukraine situation comes to resolution during the third week of next month, I would expect that to outweigh any price impact of trading by options dealers.
What can investors do?
Although day-traders and hedge funds might use this information to inform a strategy, long-term investors should probably focus on achieving their future financial goals. These investors would be well-served to generally ignore the daily price fluctuations that come with OpEx or any other news item.
For long-term investors, this data is relevant mostly as something to keep in mind when they notice daily price volatility. Amongst the regular host on concerns, investors should probably check the calendar to see whether it’s the third week of the month. If so, they may attribute at least part of the move to market mechanics. This could provide some comfort during volatile periods.
***
Thanks, Lee!
footnotes:
1 Throughout this article, SPDR S&P 500 ETF (SPY) returns from Yahoo Finance are used as proxy for the S&P 500.


