
What if – and I know for some of you this seems impossible – but what if the metric or variable you believe to be the most important one for the stock market turns out not to be? Can you live with that or will you die on that hill? Will you double down, stick to your story and lash out with claims of the market being late, wrong or, gasp, manipulated because it doesn’t agree with you?
What if that thing you have been obsessing over – debt, deficits, who is the president, interest rates, earnings growth, tax rates, gas prices – really just isn’t the deciding variable after all?
If I had asked you back in March what the most important input for stock prices would be six months from now you would have said “the virus.” I would have also. And we both would have meant less cases is better for the stock market than more.
Well, cases are exploding to the upside and so is the stock market. Because that variable – the US infection rate – turns out not to have been the only important factor in determining whether or not people would want to buy stocks at higher prices.
Here are some of the other variables, many of which are directly related to or responding to “the virus”…
1. Federal Reserve
2. Foreign central banks
3. Fiscal stimulus
4. Deferred rents and mortgage payments
5. Ecommerce / digital economic transformation
6. Cloud adoption
7. Treatments / vaccines
8. Death rates
9. Political outcomes
10. Housing demand / mortgage rates
And here’s what it looks like when the variable you thought was most important to the stock market turns out not to have been – here’s total cases vs the S&P 500 price index:
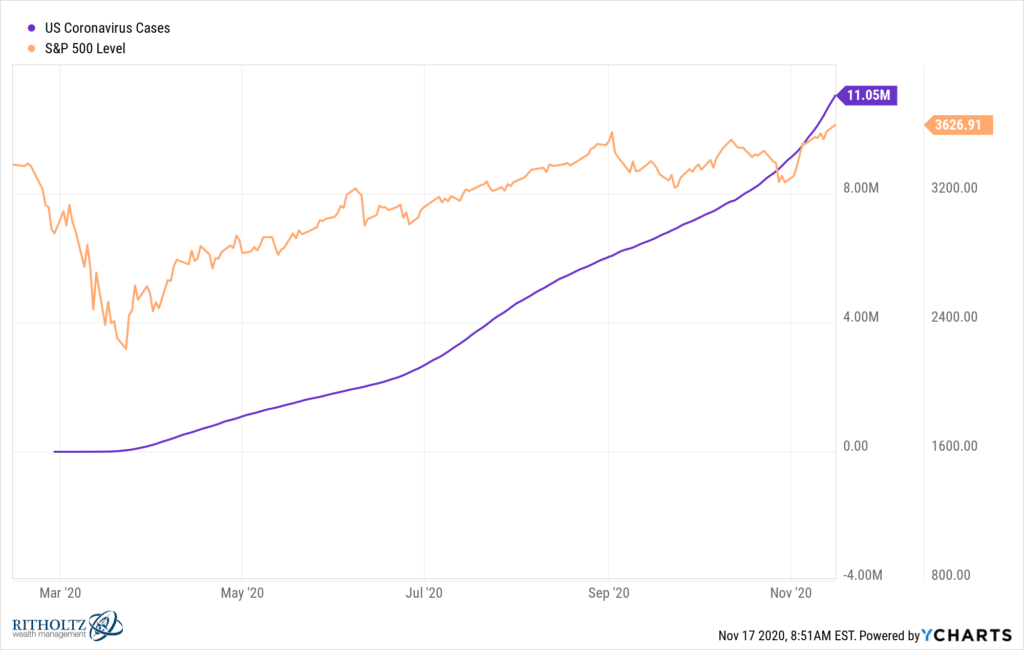
Now, ten years from now, would a person look at this six month period and conclude “stocks like infections”? Only if they don’t understand that one variable is never enough. If their conclusion was that pandemics are bullish, they’re obviously drawing the wrong one.
You can do this same thing with “stocks like Democratic presidents” or any other single-variable analysis someone lays upon your table. Your response to this type of thing should always be “Okay, I understand you see a meaningful correlation, but just humor me – what else was going on over this time period? What were some of the other variables?”
Don’t show anyone the chart above, btw. It’s only going to upset them.
But believe me when I tell you – no variable exists in a vacuum.
No variable asserts itself on the stock market strongly enough and for long enough without ultimately being countermanded by other variables. The government’s response to the pandemic is a perfect example of that. The worse the virus got, the more urgent the shutdown, the more obvious the need to mail checks out to tens of millions of consumers who would plow that money directly into the economy immediately. Cause and effect. Even the worst variable you could think of – in this case, literally the angel of death visiting us in our beds – will run up against an opposing variable soon enough to offset its effect on the stock market.


