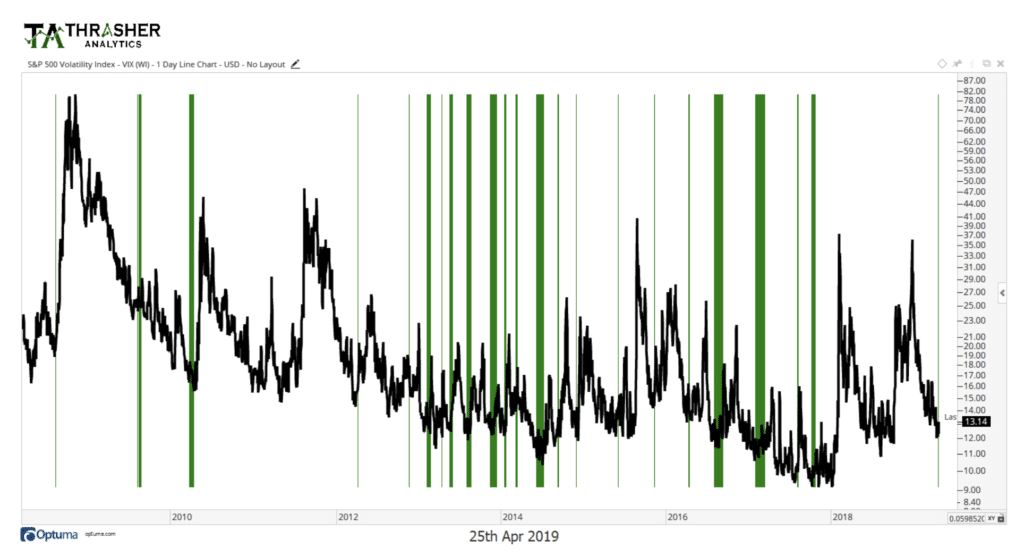
Josh here – my friend Andrew Thrasher wrote this up at my request after sharing the below chart with me. Andrew focuses a lot on volatility, and what types of market conditions typically precede the sort of “volatility tsunamis” that appear from time to time. Have a look at the chart and read why Andrew is concerned about what’s setting up.
***
Volatility across the Major Indices Is Showing Signs of Over-Confidence
Equities markets have been on a tear these last few months. Jason Goepfert, CMT at SentimenTrader recently noted that the rally off the December S&P 500 bottom has so far been one of the strongest and quickest compared to previous recovery periods going back to the 1950s. This trend in stocks has broken historical patterns, which have often seen a test of the initial low before a new uptrend has been formed. Instead a v-shaped bounce was created as stocks moved nearly in a straight line back to their mid-2018 highs. With that, volatility has gotten crushed, sending the Volatility Index (VIX) from its December 24th high of 36 down to a paltry 12. As stocks move higher, sentiment naturally improves and the expectation of (or fear of) higher volatility begins to move from the backburner of investor’s minds into the wastebasket.
In 2017 I wrote a paper titled, Forecasting a Volatility Tsunami, which won the Charles H. Dow Award from the CMT Association. In the paper, I discuss the common volatility environment of dispersion (think standard deviation) becoming very low ahead of many eventual spikes higher in the VIX. While not every period of low volatility dispersion precedes a major move higher in volatility, most previous spikes we’ve experienced in the last ten or so years have followed a steep decline in volatility standard deviation. I believe this occurs as a result of rising sentiment by the investment public – the daily rises and declines of volatility begin to shrink as a build-up in confidence ensues.
I last wrote on my blog about the shrinking dispersion in weekly volatility last September when, ironically, 30-day volatility was at about the same level it is today. The VIX remained relatively flat for the remainder of the month until the match was light on October 4th as the resulting up trend in volatility began as stocks sold off.
Once again, volatility has begun to compress; except it’s not just in the VIX, volatility for the Dow, NASDAQ 100, and Russell 2000 also are seeing their respective measures of volatility decline to historically low levels. This has happened quite a few times over the last ten years, as shown in the chart below – many of the occurrences being followed by a rise in the VIX. This tells us that it’s not just the large cap S&P 500 stocks that are experiencing a degree of over-confidence as expressed by the Volatility Index, but also the other major U.S. equity indices as well. As I wrote in my paper, volatility dispersion by itself is not meant to be a stand-alone tool used to gauge trader sentiment or time the volatility market. This form of analysis is one tool of many in my personal toolbox for analyzing the market and is similar to one of the inputs that I incorporate in my Volatility Risk Trigger at Thrasher Analytics. Going forward I’ll be keeping a close eye on the breakout level of the U.S. equity indices to see if they can hold. If price does in fact fail to stay above the prior highs, then it’s possible we see a “cooling off” period in stocks that’s accompanied by a rise in volatility. This doesn’t mean we must repeat Q4 of last year, but some degree of a pullback would be natural and healthy for the market.

***
Josh here – now, whether or not this should concern you is going to be a function of what kind of investor / trader you are, and what your process tells you to do during periods of market stress. Some strategies are set up to reduce exposure to stocks during bouts of volatility and other strategies are designed to increase exposure, or to add to stock allocations at a fixed interval regardless of market conditions. Still other strategies are designed to absolutely nothing, no matter what. Regardless of how you’re investing, volatility presents us all with the opportunity to remain humble, and to accept that we have very little (zero) control over what is to come, the only thing we control is our own reaction (or lack of reaction) to these events.
Watch my recent video conversation with Andrew Thrasher here


… [Trackback]
[…] Read More Info here on that Topic: thereformedbroker.com/2019/04/25/is-a-volatility-tsunami-imminent/ […]
… [Trackback]
[…] Info on that Topic: thereformedbroker.com/2019/04/25/is-a-volatility-tsunami-imminent/ […]
… [Trackback]
[…] Find More on to that Topic: thereformedbroker.com/2019/04/25/is-a-volatility-tsunami-imminent/ […]
… [Trackback]
[…] Find More to that Topic: thereformedbroker.com/2019/04/25/is-a-volatility-tsunami-imminent/ […]
… [Trackback]
[…] Find More to that Topic: thereformedbroker.com/2019/04/25/is-a-volatility-tsunami-imminent/ […]
… [Trackback]
[…] There you will find 28019 more Info to that Topic: thereformedbroker.com/2019/04/25/is-a-volatility-tsunami-imminent/ […]
… [Trackback]
[…] Info to that Topic: thereformedbroker.com/2019/04/25/is-a-volatility-tsunami-imminent/ […]
… [Trackback]
[…] Read More here on that Topic: thereformedbroker.com/2019/04/25/is-a-volatility-tsunami-imminent/ […]
cheap generic cialis
SPA
buy cialis 36 hour online
USA delivery