This content, which contains security-related opinions and/or information, is provided for informational purposes only and should not be relied upon in any manner as professional advice, or an endorsement of any practices, products or services. There can be no guarantees or assurances that the views expressed here will be applicable for any particular facts or circumstances, and should not be relied upon in any manner. You should consult your own advisers as to legal, business, tax, and other related matters concerning any investment.
The commentary in this “post” (including any related blog, podcasts, videos, and social media) reflects the personal opinions, viewpoints, and analyses of the Ritholtz Wealth Management employees providing such comments, and should not be regarded the views of Ritholtz Wealth Management LLC. or its respective affiliates or as a description of advisory services provided by Ritholtz Wealth Management or performance returns of any Ritholtz Wealth Management Investments client.
References to any securities or digital assets, or performance data, are for illustrative purposes only and do not constitute an investment recommendation or offer to provide investment advisory services. Charts and graphs provided within are for informational purposes solely and should not be relied upon when making any investment decision. Past performance is not indicative of future results. The content speaks only as of the date indicated. Any projections, estimates, forecasts, targets, prospects, and/or opinions expressed in these materials are subject to change without notice and may differ or be contrary to opinions expressed by others.
Wealthcast Media, an affiliate of Ritholtz Wealth Management, receives payment from various entities for advertisements in affiliated podcasts, blogs and emails. Inclusion of such advertisements does not constitute or imply endorsement, sponsorship or recommendation thereof, or any affiliation therewith, by the Content Creator or by Ritholtz Wealth Management or any of its employees. Investments in securities involve the risk of loss. For additional advertisement disclaimers see here: https://www.ritholtzwealth.com/advertising-disclaimers
Please see disclosures here.

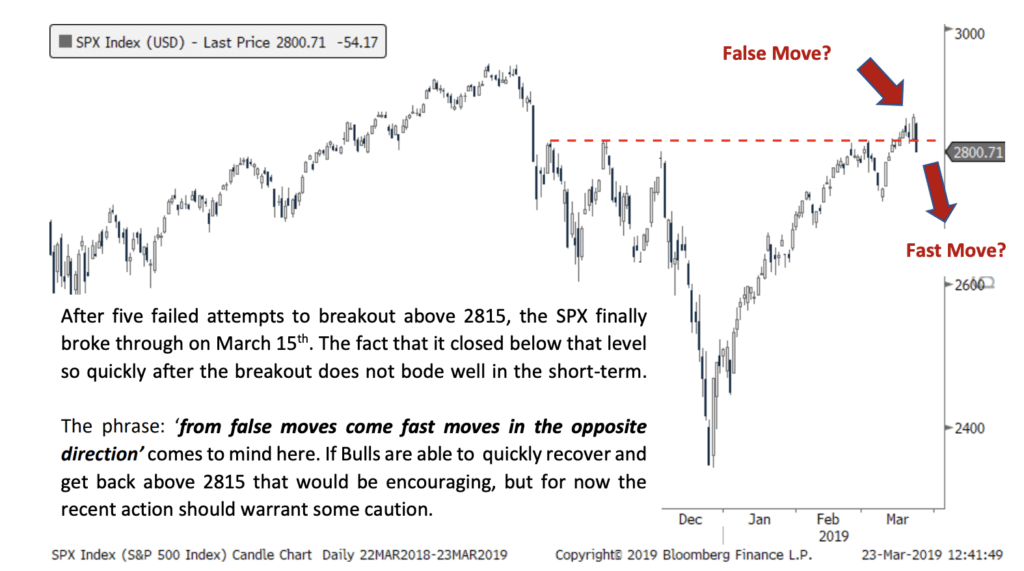


[…] Jon goes on to note that “Overall breadth remains a concern (just 38% of R3K above 200 DMA), and Friday’s 87% NYSE down volume day (highest since Dec. 4 th) is perhaps indicative of sellers w… Source: https://thereformedbroker.com/2019/03/25/the-false-breakout/ […]
[…] The False Breakout – Josh Brown Here’s a short blog post from Josh Brown of Ritholtz Wealth Management. He shares a chart from technician, Jon Krinsky that shows the potential false breakout that’s developing in the S&P 500 right now. […]
[…] in elsewhere, Reformed Broker’s Josh Brown wondered on his blog whether bulls got too excited and are now “trapped” above that 2,815 level. He highlights a […]
[…] in elsewhere, Reformed Broker’s Josh Brown wondered on his blog whether bulls got too excited and are now “trapped” above that 2,815 level. He […]
[…] in elsewhere, Reformed Broker’s Josh Brown wondered on his blog whether bulls got too excited and are now “trapped” above that 2,815 level. He highlights a […]
[…] in elsewhere, Reformed Broker’s Josh Brown wondered on his blog whether bulls got too excited and are now “trapped” above that 2,815 level. He highlights a […]
[…] in elsewhere, Reformed Broker’s Josh Brown wondered on his blog whether bulls got too excited and are now “trapped” above that 2,815 level. He […]
[…] in elsewhere, Reformed Broker’s Josh Brown wondered on his blog whether bulls got too excited and are now “trapped” above that 2,815 level. He […]
[…] in elsewhere, Reformed Broker’s Josh Brown wondered on his blog whether bulls got too excited and are now “trapped” above that 2,815 level. He […]
[…] in elsewhere, Reformed Broker’s Josh Brown wondered on his blog whether bulls got too excited and are now “trapped” above that 2,815 level. He […]
[…] in elsewhere, Reformed Broker’s Josh Brown wondered on his blog whether bulls got too excited and are now “trapped” above that 2,815 level. He […]
[…] in elsewhere, Reformed Broker’s Josh Brown wondered on his blogwhether bulls got too excited and are now “trapped” above that 2,815 level. He […]
[…] in elsewhere, Reformed Broker’s Josh Brown wondered on his blogwhether bulls got too excited and are now “trapped” above that 2,815 level. He […]
[…] in elsewhere, Reformed Broker’s Josh Brown wondered on his blogwhether bulls got too excited and are now “trapped” above that 2,815 level. He […]
[…] in elsewhere, Reformed Broker’s Josh Brown wondered on his blogwhether bulls got too excited and are now “trapped” above that 2,815 level. He […]