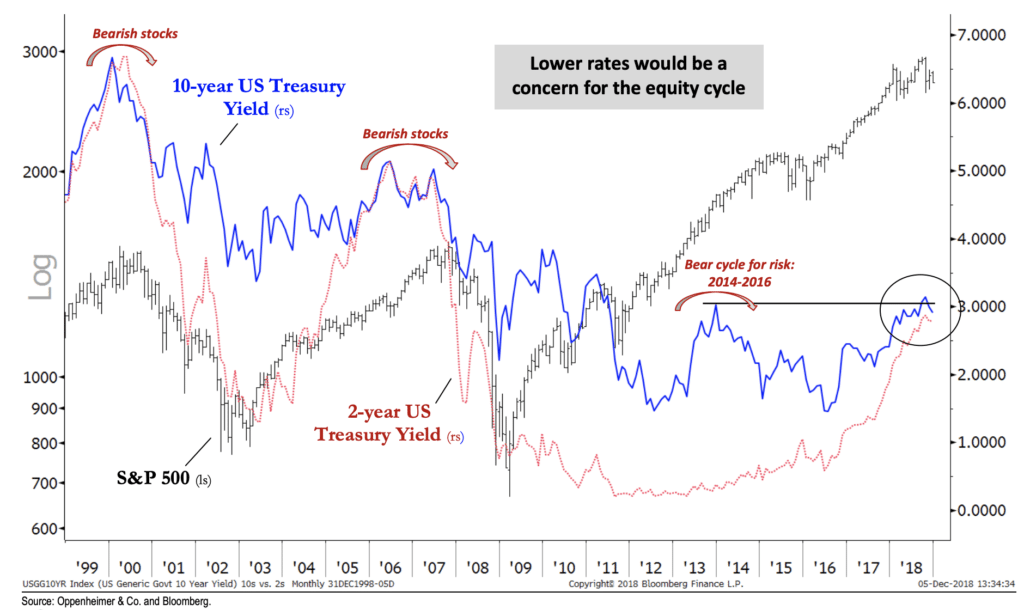
You better hope interest rates didn’t just peak for the cycle with the 10-year failing at 3.05%. So says Ari Wald (technician at OpCo), whose chart this weekend looks at 10-year treasury yield breakdowns as a leading (or coincident) indicator for major turning points in the S&P 500 / economy.
Here’s Ari:
Looking back at the last economic cycle, the 10-year US Treasury yield peaked coincidentally with an inversion in the yield curve in 2006. However, it was a definitive breakdown in rates that occurred while the equity market topped in 2000 and 2007—we’re still missing this breakdown, in our view. In other words, we view the moderation in the 10-year yield as a warning (that could last months) but we don’t yet see the sharp turn lower that typically marks the end of the cycle.
And his chart – S&P 500 index price is the left scale, bond yields is the right…

If you were worried about rates going too high, be careful what you wish for. A definitive breakdown in yields is not the best case scenario here. Flattening before a resumption higher would actually be preferable to prolong the cycle.
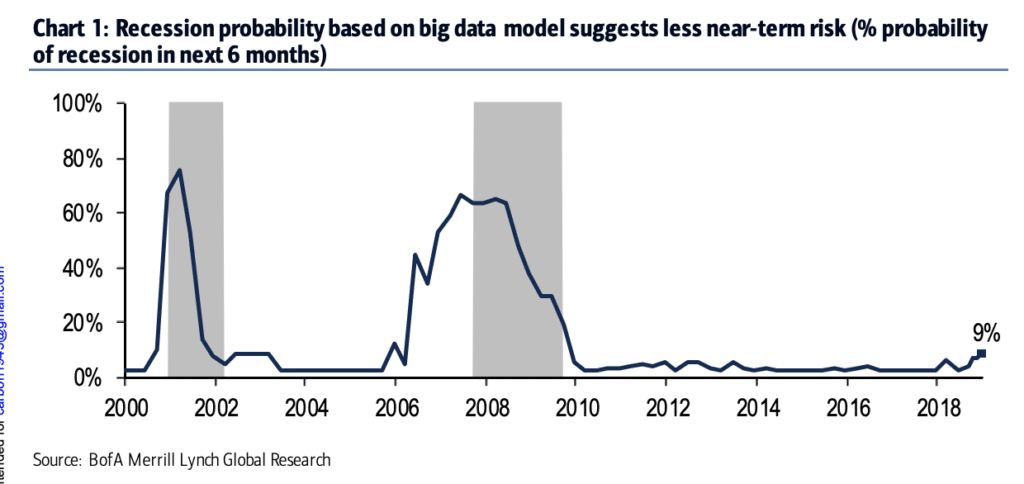
Speaking of cycles, the economic team at Bank of America says the risk of recession in the next six months is probably being overstated on Wall Street and in the media. They’ve introduced a new big data model that shows less than a 10% chance that the US economy falls into recession in the first half of 2019. Here’s BofA Merrill’s Ethan Harris & Co on the inputs they’re using…
We introduce a new big data recession probability model that accounts for a broader basket of indicators: the 3mo-10yr treasury spread, building permits, commercial & industrial (C&I) loans, S&P 500, real consumption, and corporate spreads. This model suggests less risk of a near term recession, predicting a 6-mo ahead probability of 9%. While we don’t recommend ignoring the markets’ signals, we do recommend taking them in context with the economic data. With regards to the Fed, we think the economic data will take on even more importance in the coming year.
And their chart of what this data blend currently looks like (vs recent history):

Josh here – so after almost 9 straight years of recovery, a modest uptick in the risk of recession. Is anyone falling out of their chair?
But what about the yield curve inversion that everyone was talking about last week? Is it coming to kill us?
Well, yes and no. It’s not great that the 2-year and 5-year treasury bond yields inverted last week. Nor is it a great sign that the 2-year and 10-year got so close. But (there’s always a but), read what JPMorgan Asset Management had to say about this in their Weekly Market Recap (emphasis mine):
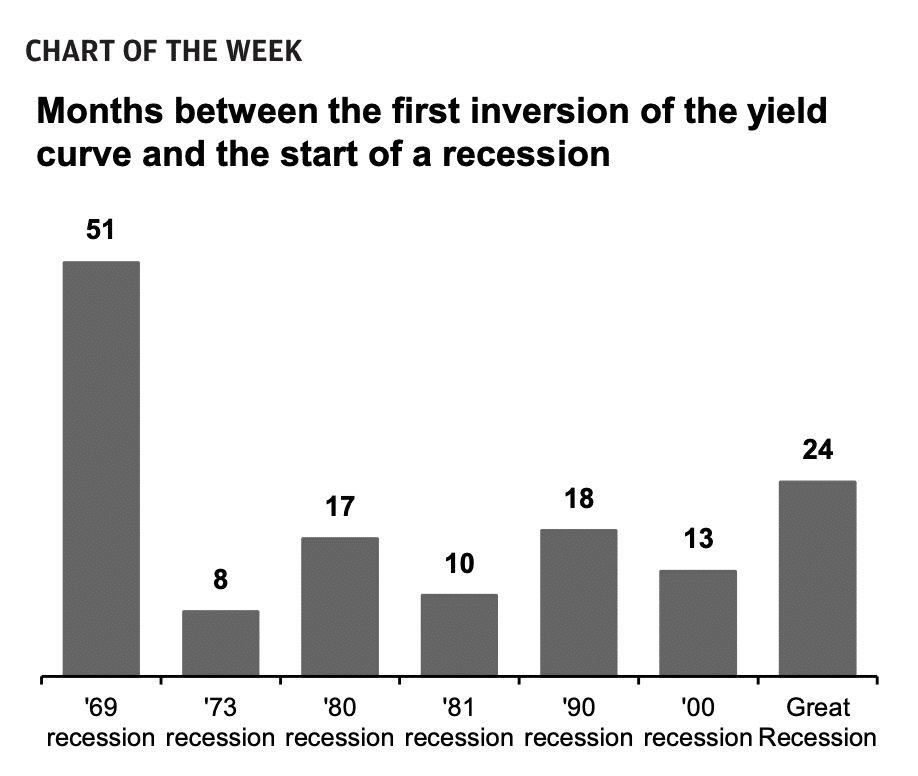
Last week, the topic of the yield curve came back to the forefront, as parts of the yield curve inverted and the spread between 2-year and 10-year yields fell to the lowest level this expansion. Investors tend to fear yield curve inversion, looking at it as a signal that a recession is looming. However, we believe investors should not overreact to these recent moves for a few reasons. First, a flattening of the yield curve is common during rate hiking cycles, which is where we are today. Second, this time around, the shape of the curve has been distorted by central bank asset purchases around the world, making it a less trustworthy predictor of recession. Lastly, the curve can stay flat for a long period of time before inverting, and even then a recession can take a while to arrive. Over the last 7 recessions, it has taken an average of 20 months between the first inversion of the curve and the start of a recession.
Here’s their table of how long it’s taken during each of the last recessions from the first yield curve inversion til the actual start of the recession…

Michael and I covered a bunch of these points about the yield curve in our video last week, which has gotten more views than anything we’ve ever done on the YouTube channel.
Watch it and subscribe if you haven’t already…
So about the R Word. Yes, we’re all talking about. That’s probably a good thing, not a bad thing. They can’t sneak up on you if you’re allowing for the possibility and being frank about the environment we’re in. But the data indicates we’re simply not there yet.
Now here’s the most important thing I want you to take away from this. We do not attempt to forecast recessions as part of our investment process. Engaging in this sort of thing is literally the antithesis of what we stand for as an investment manager and financial advisory firm. But we need to be aware of prevailing sentiment surrounding the topic so that we can have meaningful discussions with the people we’re responsible to – our clients.
If trying to predict and time recessions is something you’re interested in, however, I recommend following Bill McBride’s blog, Calculated Risk. He’s the only one writing about the topic that I trust to possibly get it right. He has nothing to sell you, just reads the data and tells the truth. He was right about both the housing collapse and the recovery, in real time. Turn off the TV and delete the think tank op-eds from your inbox. Just read Bill.
If you need some help making sure your financial plan and portfolio are prepared for 2019, recession or not, talk to us here:
Sources:
Technical Analysis: Inflection Points
Oppenheimer & Co – December 9th, 2018
Stoking recession fears
Bank of America Merrill Lynch – December 10th, 2018
Weekly Market Recap
JPMorgan Asset Management – December 10th, 2018


[…] You better hope interest rates didn’t just peak for the cycle with the 10-year failing at 3.05%. So says Ari Wald (technician at OpCo), whose chart this weekend looks at 10-year treasury yield breakdowns as a leading (or coincident) indicator for major turning points in the S&P 500 / economy. Here’s Ari: Looking back at the last economic cycle, the 10-year US Treasury yield peaked coincidentally with an in… Source: https://thereformedbroker.com/2018/12/10/the-r-word/ […]
[…] The R Word (thereformedbroker.com) – The best piece about yield curves I’ve seen since the media market hysteria has started. […]
… [Trackback]
[…] There you will find 60887 additional Info on that Topic: thereformedbroker.com/2018/12/10/the-r-word/ […]
… [Trackback]
[…] Find More here to that Topic: thereformedbroker.com/2018/12/10/the-r-word/ […]
… [Trackback]
[…] Here you can find 18051 more Information on that Topic: thereformedbroker.com/2018/12/10/the-r-word/ […]
… [Trackback]
[…] Here you will find 73467 more Info on that Topic: thereformedbroker.com/2018/12/10/the-r-word/ […]
… [Trackback]
[…] Read More to that Topic: thereformedbroker.com/2018/12/10/the-r-word/ […]
… [Trackback]
[…] Information to that Topic: thereformedbroker.com/2018/12/10/the-r-word/ […]
… [Trackback]
[…] Here you will find 94939 additional Information on that Topic: thereformedbroker.com/2018/12/10/the-r-word/ […]
… [Trackback]
[…] Find More on on that Topic: thereformedbroker.com/2018/12/10/the-r-word/ […]
… [Trackback]
[…] Read More here on that Topic: thereformedbroker.com/2018/12/10/the-r-word/ […]
… [Trackback]
[…] Information on that Topic: thereformedbroker.com/2018/12/10/the-r-word/ […]
… [Trackback]
[…] Read More here on that Topic: thereformedbroker.com/2018/12/10/the-r-word/ […]
monthly cost of cialis without insurance
Health
buy cialis without perscription
American health