What a friend we have in time
Gives us children, makes us wine
Tells us what to take or leave behind
– John Denver
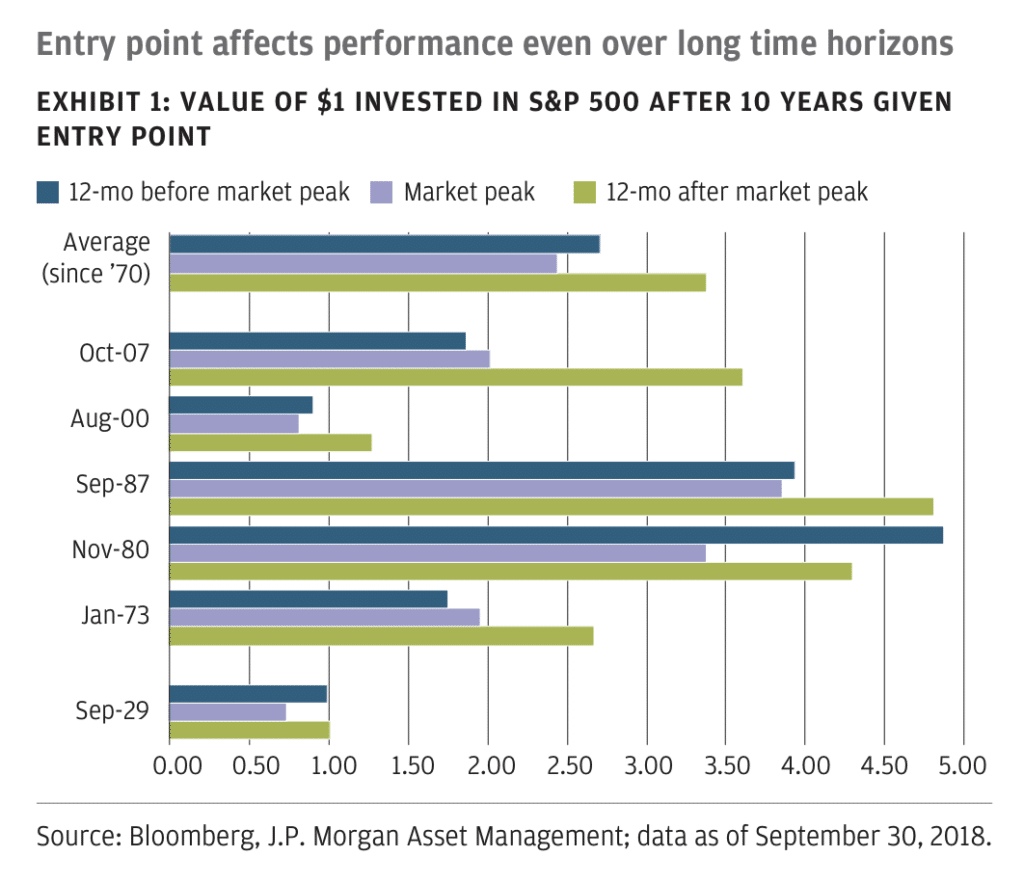
The good thing about having a long-term time horizon is that, with dollar cost averaging of the sort you do in a 401(k) or similar account, the effects of market peaks are eventually blunted. It begins not to matter that some of your allocation to the stock market occurred at high points.
But that’s over multi-year periods and decades.
J.P.Morgan Asset Management is out with its 2019 Long-Term Capital Markets Assumptions piece this week and, in the chart below, they take a look at the effects of ten-year returns for investors buying the S&P 500 a year before the market peaks, at the peak, and then a year later. In none of these cases are the results egregious, and again, the chart assumes a one-time lump sum, which is not the way people actually invest IRL. But anyway, here it is…
Speaking of market peaks, do not miss Michael’s excellent survey of charts looking at the drawdown in Amazon this fall. It’s one of only 25 stocks that have added over $100 billion in market cap since the March 2009 bottom, and since then its shareholders have had to endure five (5!) separate drawdowns of 20% or more. Despite these recurring drawdowns, the stock has appreciated at roughly 40% a year on average, which is breathtaking.
Did you know that Amazon has lost more in market cap this fall than THE ENTIRE COMPANY WAS WORTH IN 2016? True story, link below:
[…] Dealer’s Josh Brown highlighted this chart on hisblognow not too lengthy ago, and it makes the within the reduction of as ourchart of the day. The J.P. […]
[…] Here you will find 9783 additional Information on that Topic: thereformedbroker.com/2018/10/31/chart-o-the-day-buying-stocks-before-during-and-after-the-peak/ […]
[…] There you can find 25939 more Information to that Topic: thereformedbroker.com/2018/10/31/chart-o-the-day-buying-stocks-before-during-and-after-the-peak/ […]
[…] Here you can find 20595 more Information on that Topic: thereformedbroker.com/2018/10/31/chart-o-the-day-buying-stocks-before-during-and-after-the-peak/ […]
I’m a New York City-based financial advisor at Ritholtz Wealth Management LLC. I help people invest and manage portfolios for them. For disclosure information please see here.
Get a Full Investor Curriculum: Join The Book List
Every month you'll receive 3-4 book suggestions--chosen by hand from more than 1,000 books. You'll also receive an extensive curriculum (books, articles, papers, videos) in PDF form right away.


[…] Dealer’s Josh Brown highlighted this chart on hisblognow not too lengthy ago, and it makes the within the reduction of as ourchart of the day. The J.P. […]
… [Trackback]
[…] Read More here to that Topic: thereformedbroker.com/2018/10/31/chart-o-the-day-buying-stocks-before-during-and-after-the-peak/ […]
… [Trackback]
[…] Find More on that Topic: thereformedbroker.com/2018/10/31/chart-o-the-day-buying-stocks-before-during-and-after-the-peak/ […]
… [Trackback]
[…] Find More on that Topic: thereformedbroker.com/2018/10/31/chart-o-the-day-buying-stocks-before-during-and-after-the-peak/ […]
… [Trackback]
[…] Read More on that Topic: thereformedbroker.com/2018/10/31/chart-o-the-day-buying-stocks-before-during-and-after-the-peak/ […]
… [Trackback]
[…] Read More Information here on that Topic: thereformedbroker.com/2018/10/31/chart-o-the-day-buying-stocks-before-during-and-after-the-peak/ […]
… [Trackback]
[…] Here you will find 9783 additional Information on that Topic: thereformedbroker.com/2018/10/31/chart-o-the-day-buying-stocks-before-during-and-after-the-peak/ […]
… [Trackback]
[…] Find More Info here on that Topic: thereformedbroker.com/2018/10/31/chart-o-the-day-buying-stocks-before-during-and-after-the-peak/ […]
… [Trackback]
[…] Information to that Topic: thereformedbroker.com/2018/10/31/chart-o-the-day-buying-stocks-before-during-and-after-the-peak/ […]
… [Trackback]
[…] Read More Information here to that Topic: thereformedbroker.com/2018/10/31/chart-o-the-day-buying-stocks-before-during-and-after-the-peak/ […]
… [Trackback]
[…] There you can find 25939 more Information to that Topic: thereformedbroker.com/2018/10/31/chart-o-the-day-buying-stocks-before-during-and-after-the-peak/ […]
… [Trackback]
[…] Here you can find 20595 more Information on that Topic: thereformedbroker.com/2018/10/31/chart-o-the-day-buying-stocks-before-during-and-after-the-peak/ […]
… [Trackback]
[…] Read More here on that Topic: thereformedbroker.com/2018/10/31/chart-o-the-day-buying-stocks-before-during-and-after-the-peak/ […]
… [Trackback]
[…] Find More Information here on that Topic: thereformedbroker.com/2018/10/31/chart-o-the-day-buying-stocks-before-during-and-after-the-peak/ […]