My friend Ari Wald has a good note out this weekend from his perch as Oppenheimer’s market technician. He points out this year, interest rates have risen above 3% after a decade below, and that the last time we’ve seen something like this occurred in the late 1950’s. He sees the washout in the percentage of stocks now below technically oversold conditions as setting up a tactical buying opportunity but he’s preaching selectivity – mainly looking at large cap growth names in strong sectors (healthcare, tech) that have fallen into rising 200-day moving averages (support).
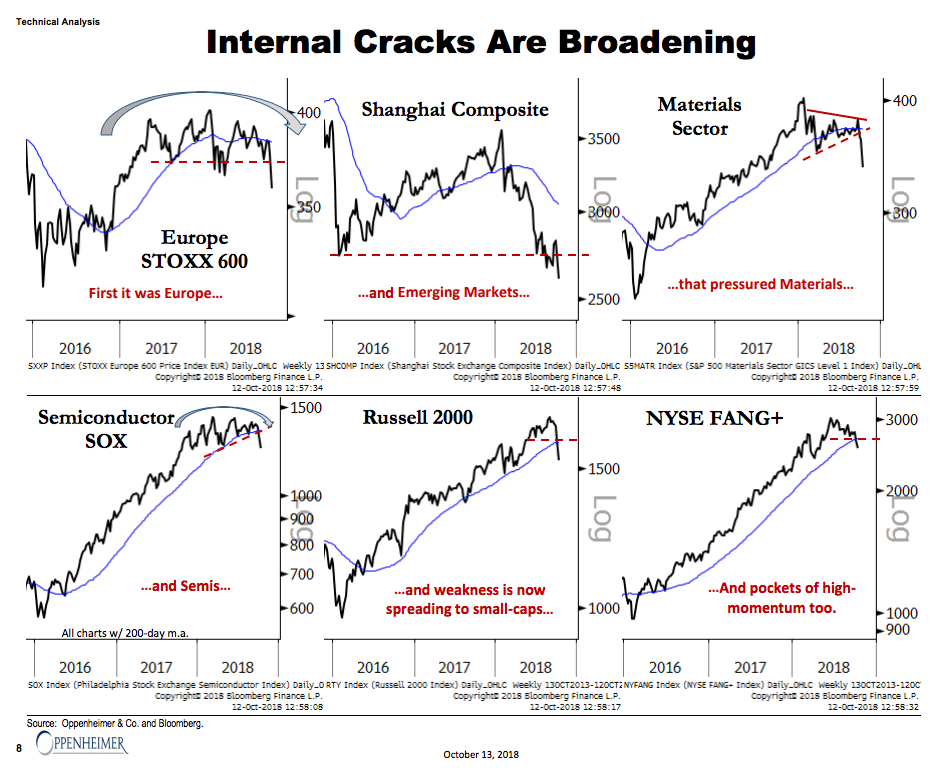
I really liked this chart, showing how the weakness in US stocks this month has actually been imported from overseas markets, directly into the segments of the US market that are susceptible to a global slowdown. 2017’s narrative was the “synchronized global recovery” as the news and price action in both developed and emerging markets were improving together. This year, it’s the opposite, and that weakness has spread.
Check this out:
We believe recent selling has been about overseas weakness in both developed and emerging market regions, like Europe and China, spreading to globally-exposed US segments, like Semiconductors and Materials, and more recently to Small-caps and select high-momentum names, like NYFANG+, too

Source:
The 1955 Redux
Oppenheimer & Co – October 13th, 2018


… [Trackback]
[…] Read More Information here on that Topic: thereformedbroker.com/2018/10/14/chart-o-the-day-synchronized-global-meh/ […]
… [Trackback]
[…] Information on that Topic: thereformedbroker.com/2018/10/14/chart-o-the-day-synchronized-global-meh/ […]
… [Trackback]
[…] Find More on to that Topic: thereformedbroker.com/2018/10/14/chart-o-the-day-synchronized-global-meh/ […]
… [Trackback]
[…] Find More on that Topic: thereformedbroker.com/2018/10/14/chart-o-the-day-synchronized-global-meh/ […]
… [Trackback]
[…] Read More to that Topic: thereformedbroker.com/2018/10/14/chart-o-the-day-synchronized-global-meh/ […]