Last week, we held our quarterly conference call for Ritholtz Wealth Management, in which Chairman and CIO Barry Ritholtz tackled a host of topics – from presidents’ impact on stock markets to interest rates to annual returns. The call was accompanied by our regular quarterly letter.
One section I found to be very helpful for clients had to do with the CAPE ratio and the concern that valuations on US stocks are elevated relative to history right now. Here’s what Barry and our director of research, Michael Batnick, had to say on the subject:
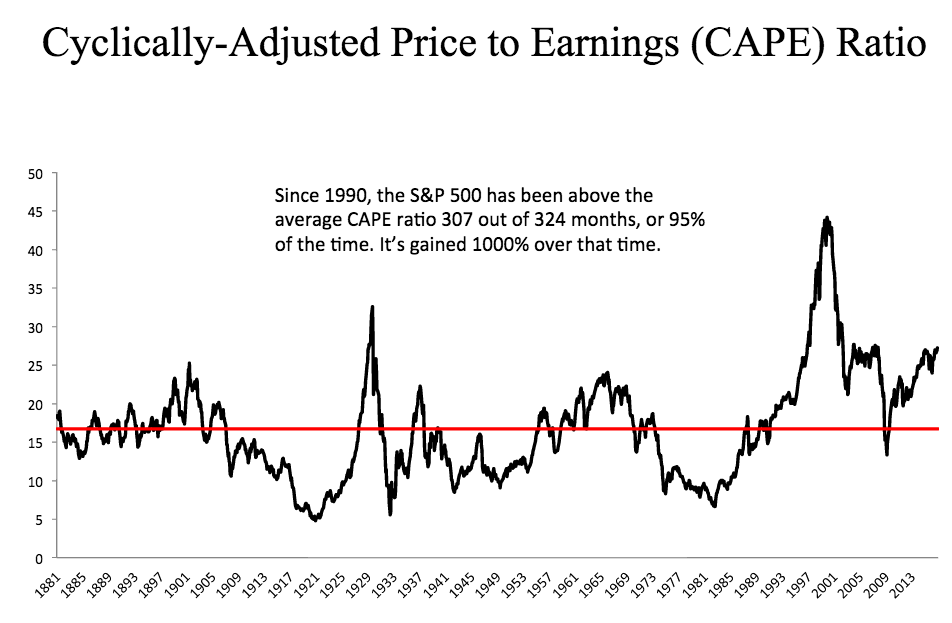
Let’s start with CAPE – the Cyclically Adjusted Price to Earnings ratio. Think of it as the 10-year P/E. It is high for US equities by historical averages, elevated for Japan, moderate for Europe, and low for emerging markets. If we wanted to scare people, we would selectively pull data out showing at present we have the highest reading outside of 2000 (43.2), 1929 (32.5) and 2007 (27.6). But we don’t cherry pick dates to scare people, instead we use data to look for evidence.
Since 1990, the S&P 500 has been trading above the average CAPE ratio during 307 out of 324 months – that’s a total of 95% of the time. If you exited US equities when the CAPE ratio was overvalued, you would have missed gains of more than a 1000% over that time. In fact, had you only invested when the CAPE was 25% overvalued – i.e. when stocks were “very expensive” – your total returns since 1990 would have been 650%. This is one of the many reasons why it is ill advised to use valuation as a timing mechanism.
The most we can really say about a higher than average CAPE is that when it is significantly above its long-term average, we should lower our expectations for future returns. When we look around the world, we see the United States is more expensive than Europe, or emerging markets, or Japan on nearly every single valuation metric. This should not be surprising, given how much the United States has outperformed other countries since the financial crisis ended in 2009. The good news is that our portfolio is exposed to global equities, and as the equity leadership shifts – whenever that might be – our portfolios will benefit from it.

Josh here – one interesting thing to keep in mind is that, while the CAPE for US stocks is currently 25.5, the CAPE for Europe is a more reasonable 15.6 and just 14.4 for Emerging Markets stocks. Additionally, the massive profit wipeouts from 2009, which are obviously biasing the ratio higher, will be rolling off in 2020. Finally, as Professor Jeremy Siegel has pointed out, we’re comparing apples to oranges to some extent, given the fact that the accounting treatment of earnings and losses has changed from one era to the next, which changes the composition of as-reported numbers.
Rather than dismissing valuation concerns out of hand, we prefer to worry think about them in the context of an overall asset allocation plan. For as long as you will be an investor, there will always be valuation concerns for one asset class or another.
If you’re interested in learning more about how we work with clients on their financial plans and investment portfolios, talk to us here:


[…] How to think about current valuations. (thereformedbroker) […]
[…] given a 2000 tech bubble, judging by a cyclically practiced price-to-earnings ratio. It’s not unusual for a SP 500 to trade above a average CAPE ratio. But with bonds this expensive, investors should […]
[…] since the 2000 tech bubble, judging by the cyclically adjusted price-to-earnings ratio. It’s not unusual for the S&P 500 to trade above its average CAPE ratio. But with stocks this expensive, […]
[…] since the 2000 tech bubble, judging by the cyclically adjusted price-to-earnings ratio. It’s not unusual for the S&P 500 to trade above its average CAPE ratio. But with stocks this expensive, […]
[…] since the 2000 tech bubble, judging by the cyclically adjusted price-to-earnings ratio. It’s not unusual for the S&P 500 to trade above its average CAPE ratio. But with stocks this expensive, […]
[…] since the 2000 tech bubble, judging by the cyclically adjusted price-to-earnings ratio. It’s not unusual for the SP 500 to trade above its average CAPE ratio. But with stocks this expensive, investors […]
[…] since the 2000 tech bubble, judging by the cyclically adjusted price-to-earnings ratio. It’s not unusual for the S&P 500 to trade above its average CAPE ratio. But with stocks this expensive, […]
[…] since the 2000 tech bubble, judging by the cyclically adjusted price-to-earnings ratio. It’s not unusual for the S&P 500 to trade above its average CAPE ratio. But with stocks this expensive, […]
[…] the 2000 tech bubble, judging by the cyclically adjusted price tag-to-earnings ratio. It is really not unconventional for the S&P five hundred to trade previously mentioned its common CAPE ratio. But with stocks […]
[…] since the 2000 tech bubble, judging by the cyclically adjusted price-to-earnings ratio. It’s not unusual for the S&P 500 to trade above its average CAPE ratio. But with stocks this expensive, […]
[…] since the 2000 tech bubble, judging by the cyclically adjusted price-to-earnings ratio. It’s not unusual for the S&P 500 to trade above its average CAPE ratio. But with stocks this expensive, […]
[…] since the 2000 tech bubble, judging by the cyclically adjusted price-to-earnings ratio. It’s not unusual for the S&P 500 to trade above its average CAPE ratio. But with stocks this expensive, […]
[…] if you are using the CAPE ratio to determine staying invested, what happens if, since the 1990s, the CAPE ratio have been above average 95% of the time. And […]
… [Trackback]
[…] Find More on that Topic: thereformedbroker.com/2016/12/19/how-we-respond-to-client-concerns-on-valuation/ […]
… [Trackback]
[…] Read More on on that Topic: thereformedbroker.com/2016/12/19/how-we-respond-to-client-concerns-on-valuation/ […]