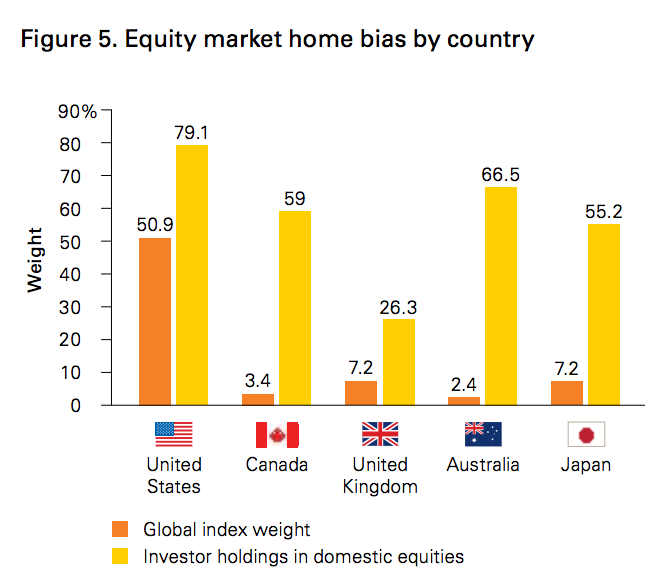
Are US investors right to hold roughly 80% of their equity exposure in US stocks, given that the US market capitalization is only 50% of the global opportunity set? If you’re judging solely by recent years, then the emphatic, backward-looking answer is a resounding “Hell yes!” If you’re judging by the data we have going back a few decades, then the answer is “sometimes” or no.
Right now, US stocks are being viewed as a bullet-proof asset class and have even been referred to as “the safety trade”, given their ascent during a rocky time for the rest of the world’s economies and geopolitical situations. But you need not look far back to discover eras during which the S&P 500 was very far from a safety trade, even relative to European or EM equities.
It turns out that US stock outperformance or underperformance over multi-year periods is largely determined by currency strength and weakness. This is a generalization, but strong dollar periods typically mean stronger US stocks versus foreign developed markets, and vice versa. This is counter-intuitive to some extent, as market pundits refer to weaker currencies as being “good for the exporters” of a given country. Not so much, on a stock market performance basis.
According to a new paper at Vanguard, there are six primary reasons for the home country bias, as we observe it throughout the English-speaking world:
• Expectations. In one of the earliest studies on the topic, French and Poterba (1991) identified investors’ expectations about future returns in their home market as a key driver.
• Preference for the familiar. Investors generally feel more comfortable with their home market and allocate investments accordingly, even if it results in a poorer risk/return trade-off for their portfolio.
• Corporate governance. Dahlquist et al. (2002) suggested that corporate governance practices have a major impact.
• Liability hedging. Stockton and Bosse (2015) illustrated that the need to hedge certain liabilities may lead to a home-country bias, especially in fixed income, but also perhaps in equities. This is because the ability to fund a clearly defined liability is increased when using assets that move in tandem with those liabilities. Similarly, domestic investor spending is often influenced more by domestic inflation and interest rates.
• Multinational companies. Investors may feel that through investment in multinational companies, they will attain as much global diversification as they will need. But as global economies become more interconnected, it’s important to consider the extent to which investment in domestic companies provides exposure to foreign markets. (Josh here – this is the Jack Bogle argument that’s pretty far off the reservation relative to what Vanguard corporate says on the subject)
• Currency. Many investors perceive foreign investments as inherently more risky than domestic holdings. For example, it is not uncommon to see investment providers’ websites or literature list foreign equities among the riskiest assets, despite the well-documented diversification benefits of including foreign securities in a diversified portfolio. Much of the volatility in foreign investing can be attributed to exchange-rate fluctuations, and the desire to avoid the influence of such movements could be an additional reason why investors allocate greater percentages of their portfolios to domestic securities.
And here’s the chart, illustrating the worst offenders of the home country bias:

As you can see, we’re guilty but not nearly as much as everyone else is. Australians in particular are outrageous 🙂
And Canadians, who have no excuse. As the study’s authors explain, “as of December 31, 2014, Canadian equities accounted for 3.4% of the global equity market. To the extent investors choose to invest in the global market regardless of their home country, they would hold 3.4% of their equity portfolio in Canadian stocks. But, on average, this was not the case among Canadian investors, who collectively held 59% at year-end in 2014.”
Source:
The buck stops here: The global case for strategic asset allocation and an examination of home bias
Vanguard – July 2016


[…] “As you possibly can see, we’re responsible however not almost as a lot as everybody else is,” writes monetary adviser Josh “The Reformed Dealer” Brown in his weblog publish concerning the report. […]
[…] “As you can see, we’re guilty but not nearly as much as everyone else is,” writes financial adviser Josh “The Reformed Broker” Brown in his blog post about the report. […]
[…] The home country bias (Reformed Broker) […]
[…] Home Country Bias: The Worst Offenders (TRB) […]
[…] Home Country Bias: The Worst Offenders (The Reformed Broker) […]
[…] live in than the market-cap weighting would suggest. The chart below is rather striking. Found via Reformed Broker and Abnormal […]
[…] domestic stocks. A recent study by Vanguard, an investment management company, found Canadians are particularly over-exposed to our shrinking stock market—Canada’s equity market makes up just 3.4 per cent of global […]
[…] display what Patrick O’Shaughnessy refers to as Portfolio Patriotism. Also known as Home Bias, this phenomenon exists across the globe and becomes exacerbated when your home country’s stock market has been THE place to be in […]
[…] noted Brown, represents just 3.4% of the global market cap, yet its citizens invest 59% of their equity portfolios in Canadian […]
[…] noted Brown, represents just 3.4% of the global market cap, yet its citizens invest 59% of their equity portfolios in Canadian […]
[…] his recent article Home Country Bias: The Worst Offenders, Joshua M. Brown presents a case that currency strength is the primary determinant of stock market […]
[…] one answer, of course, is to place at least half of your equity allocation in foreign stocks (which no one does), and preferably, more than that with exposures to the really cheap […]
[…] Source: IMF Coordinated Portfolio Investment Survey […]
[…] Ritholtz Wealth Management CEO, Josh Brown describes the current situation like this: […]
[…] live in than the market-cap weighting would suggest. The chart below is rather striking. Found via Reformed Broker and Abnormal […]