
Today’s chart comes from my pal Ari Wald, one of my fave technicians who does great work every week at Oppenheimer.
Ari takes a look at last week’s spike in the Vix, which signals a jump in short-term market fear as participants scramble for protection via options trades. Going back 25 years or so, it’s paid off to be a contrarian at moments where fear rips to the upside as quickly as it just did. Returns looking out a few weeks / months have been shown to be double the average.
Here’s Ari:
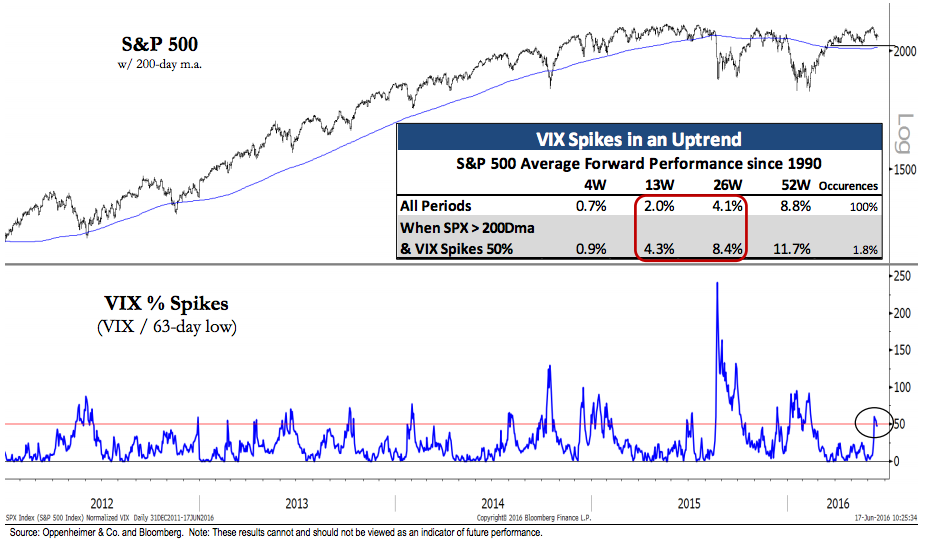
Last week’s VIX spike triggered a trading buy signal because it occurred in an uptrend, by our analysis. We define a VIX spike as a reading that is 50% higher than its 63-day low, this helps normalize for different volatility environments, and we consider the S&P 500 in an uptrend when the index is above its 200-day m.a. Spikes in the VIX typically occur around short-term market lows and we’ve found it’s a more compelling signal when trend is positive. Since 1990, the S&P 500 has averaged an 8.4% gain in the next six months when this signal of selling exhaustion is triggered vs. a 4.1% gain during any six-month period.
Source:
Technical Analysis: Inflection Points
Oppenheimer & Co – June 18th, 2016


… [Trackback]
[…] Read More to that Topic: thereformedbroker.com/2016/06/19/chart-o-the-day-buying-on-vix-spikes/ […]
… [Trackback]
[…] Info on that Topic: thereformedbroker.com/2016/06/19/chart-o-the-day-buying-on-vix-spikes/ […]