My firm’s Director of Research, Michael Batnick, has been looking at S&P 500 sector composition recently.
Below, you can see the evolution of this stuff just over the last few years:
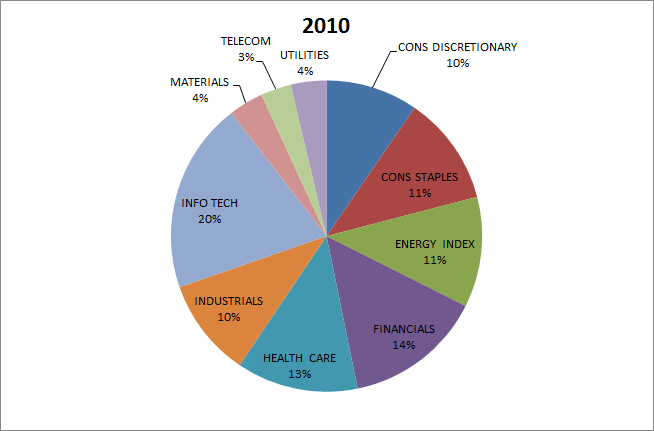
Now watch financials and energy shrink on the backside of the financial crisis / global recession:
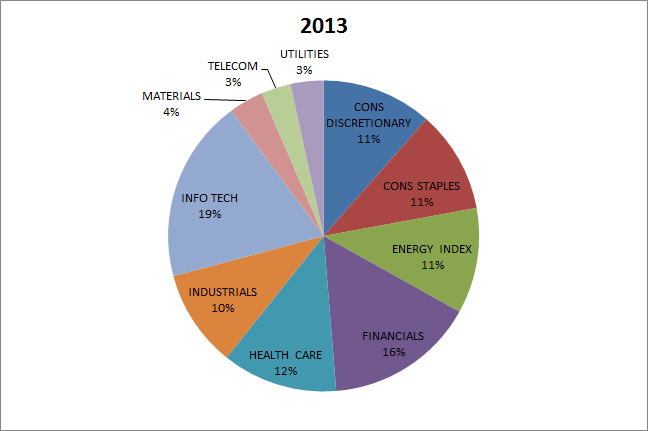
Here we are in the midst of the furious bull market two years ago:
Which brings us to 2015.
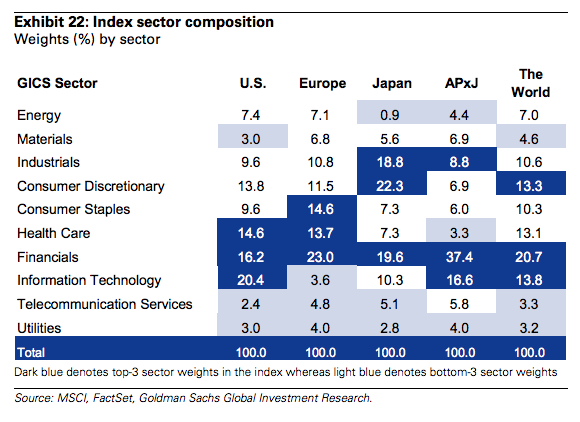
The chart below is via the Goldman Sachs Global Weekly Kickstart, a look at the sector composition of the major global stock markets:
Add up US market cap attributed to the top three sectors, Tech, Financial and Health Care and you see that Corporate America is not quite as dynamic as maybe you’d have otherwise thought – at least by this metric. It should be noted that tech and health care stocks tend to have some of the higher valuations, given their outsized earnings growth relative to the rest of the market in recent years.
Then you think about the fact that Energy and Materials combined make up just over 10% of the US stock market (and just over 11% of the world’s). Meanwhile, tech capitalization is now over a fifth of the total market and growing. Financial sector weighting has also begun growing back into its former self and health care is gaining in importance too.
When people talk about what “the market” is doing, half of what’s happening is fairly concentrated sector-wise.
Source:
Global Weekly Kickstart Goldman Sachs – October 19th 2015
I’m a New York City-based financial advisor at Ritholtz Wealth Management LLC. I help people invest and manage portfolios for them. For disclosure information please see here.
Get a Full Investor Curriculum: Join The Book List
Every month you'll receive 3-4 book suggestions--chosen by hand from more than 1,000 books. You'll also receive an extensive curriculum (books, articles, papers, videos) in PDF form right away.


RT @ReformedBroker: Tech, Banks and Health Care now make up half the US stock market
https://t.co/AWuG0pt7dN https://t.co/9xUxq5KlT0
RT @ReformedBroker: Tech, Banks and Health Care now make up half the US stock market
https://t.co/AWuG0pt7dN https://t.co/9xUxq5KlT0
RT @ReformedBroker: Tech, Banks and Health Care now make up half the US stock market
https://t.co/AWuG0pt7dN https://t.co/9xUxq5KlT0
RT @ReformedBroker: Tech, Banks and Health Care now make up half the US stock market
https://t.co/AWuG0pt7dN https://t.co/9xUxq5KlT0
RT @ReformedBroker: Tech, Banks and Health Care now make up half the US stock market
https://t.co/AWuG0pt7dN https://t.co/9xUxq5KlT0
RT @ReformedBroker: Tech, Banks and Health Care now make up half the US stock market
https://t.co/AWuG0pt7dN https://t.co/9xUxq5KlT0
RT @ReformedBroker: Tech, Banks and Health Care now make up half the US stock market
https://t.co/AWuG0pt7dN https://t.co/9xUxq5KlT0
RT @ReformedBroker: Tech, Banks and Health Care now make up half the US stock market
https://t.co/AWuG0pt7dN https://t.co/9xUxq5KlT0
RT @ReformedBroker: Tech, Banks and Health Care now make up half the US stock market
https://t.co/AWuG0pt7dN https://t.co/9xUxq5KlT0
RT @ReformedBroker: Tech, Banks and Health Care now make up half the US stock market
https://t.co/AWuG0pt7dN https://t.co/9xUxq5KlT0
RT @ReformedBroker: Tech, Banks and Health Care now make up half the US stock market
https://t.co/AWuG0pt7dN https://t.co/9xUxq5KlT0
RT @ReformedBroker: Tech, Banks and Health Care now make up half the US stock market
https://t.co/AWuG0pt7dN https://t.co/9xUxq5KlT0
RT @ReformedBroker: Tech, Banks and Health Care now make up half the US stock market
https://t.co/AWuG0pt7dN https://t.co/9xUxq5KlT0
Chart o’ the Day: Tech, Banks and Health Care are half of the US stock market https://t.co/X3HWZaDUBb
RT @ReformedBroker: Tech, Banks and Health Care now make up half the US stock market
https://t.co/AWuG0pt7dN https://t.co/9xUxq5KlT0