People that respect technical analysis do so because they’ve learned that price has memory – there are levels at which buyers swamp sellers and vice versa, it is not voodoo to keep these prices (or levels) somewhere on the front burner.
Chris Kimble points out one of these price levels on the Nikkei that certainly carries with it a great deal of memory for Japanese investors and global PMs…
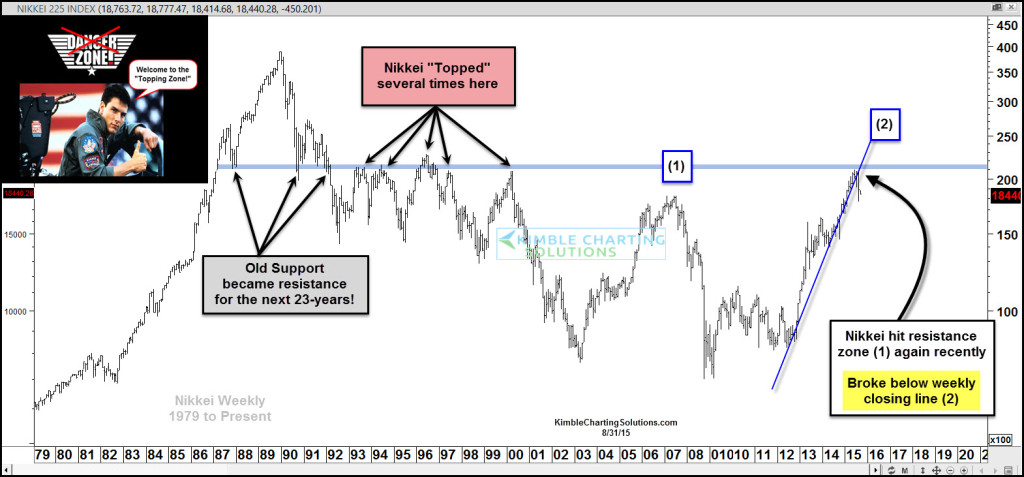
As you can see several times from 1992 to 2000 the Nikkei ran into this resistance zone and failed to solidly break above it, leading to a top numerous times. The last time it hit this resistance zone was back in 2000. After failing to break above resistance then, it proceeded to fall 50% in value from 2000 to 2003.
The Nikkei rallied strongly from 2012 to this year, up over 100% during that time frame. This rally took the Nikkei back to resistance zone (1), where so far the rally stopped again.

Josh here – Can the Nikkei escape this resistance (or topping) zone this time? It’s been one of the best places to be invested so far this year, but the global market picture is making it much more challenging than it would normally be to break away.
Source:
Nikkei (Japan) topped last 5 times it was here, its back again! (Kimble Charting Solutions)


… [Trackback]
[…] Here you can find 80300 more Info on that Topic: thereformedbroker.com/2015/09/01/chart-o-the-day-can-the-nikkei-escape/ […]
… [Trackback]
[…] Read More here on that Topic: thereformedbroker.com/2015/09/01/chart-o-the-day-can-the-nikkei-escape/ […]