The trouble with evaluating the success or failure of an asset allocation model over a short period of time – or in real-time – is that one of the primary benefits to the strategy involves non-correlated assets – and correlations aren’t constant.
A given asset class, like emerging market equities or corporate bonds for example, will display an oscillating amount of correlation to any other given asset class over any multi-year period. And then, in the next multi-year period, that correlation could change markedly once again.
Consider that REITs and Treasury bonds could either move in lockstep, move in opposite directions or switch back and forth in completely random cycles. However, when the lens is widened and you take several steps back, the non-correlated nature of two asset classes often begins to shine through – thus demonstrating the free lunch concept and its virtues for a retirement-bound investor.
We want non-correlated assets over the long term because their differences in performance allow us the opportunity to rebalance from winners to losers and pick up potential premiums that other, more short-term oriented investors are dropping at our feet. This is a logical, sound and proven strategy – but it is a strategy that many have a tough time sticking with.
It’s frustrating to an unsophisticated investor when three quarters of their portfolio is going up and one quarter is going down. The response is almost always something along the lines of “Why can’t we just own the stuff that’s going up now?”
LPL is out with a mid-year outlook piece that has lots of interesting information in it, but I especially liked this portion about how the benefits of non-correlated asset allocation sometimes don’t show up…
However, despite the near universal acceptance of the importance of diversification, having a diversified portfolio does not automatically mean investors will outperform or gain value in risk reduction.
This was best demonstrated in 2014, when despite a sixth consecutive year of stock market gains, some investors might have lagged, as most segments of global financial markets failed to keep pace with many of the popular domestic stock market indexes. The broad S&P 500 Index and the Nasdaq Composite Index finished the year up 13.7% and 14.8%, respectively, and solidly outperformed other diversifying asset classes, like small cap or international stocks, by wide margins. Investors taught not to keep “all their eggs in one basket” and diversify their portfolios were left wanting more, as their investment performance trailed these broad U.S. benchmarks.
And 2014 is not a sole outlier, as diversification failed to benefit investors twice more in recent years. In fact, the S&P 500 Index has outperformed an equal weighted portfolio of the most common equity asset classes used to diversify (mid cap, small cap, developed foreign, and emerging market stocks) by a combined average of roughly 5% in three of the past four years. Not since 1998 and the Asian Crisis, when international stocks suffered and small and mid cap stocks also underperformed, has such a large performance gap between the S&P 500 Index and the other segments of the global stock market existed.
So why not just invest in large cap stocks or the S&P 500 and abandon the notion of diversification? Simply put, to do so would be a mistake of overvaluing a short term phenomenon over a long-standing investment axiom that benefits more than it hurts. In fact, over the past 20 years, the S&P 500 has only outperformed all other major asset classes (including small, mid, foreign developed, and emerging markets) 30% of the time, and it was the worst performing asset class 25% of the time. This demonstrates the importance of investing in at least several different types of investments. Diversification has historically worked and it remains the core tenet of portfolio strategy.
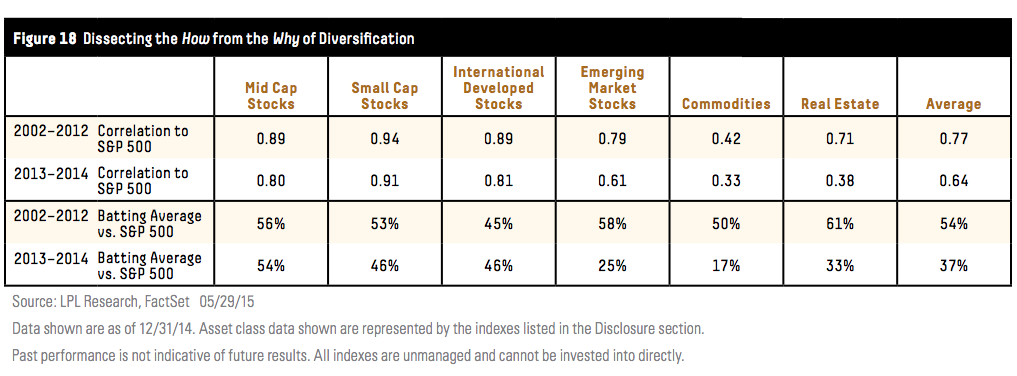
And here’s a table showing both non-correlation to the S&P as well as “batting average” against the S&P for a few asset classes over various time frames:

Josh here – it’s interesting how easily investors can focus on the recent underperformance of EM stocks vs the S&P 500 (a 25% batting average) and forget about the outperformance in a prior, longer period of time (58% batting average in the decade ending 12/2012). This obsession with recency and forgetfulness of longer term results is the opportunity for patient investors to pick up.
Source:


[…] A good reminder: correlations are not constant. (thereformedbroker) […]
Spot on piece by @reformedbroker // Correlations aren’t Constant http://t.co/ThEz7WYrV2
Correlations aren’t Constant by @ReformedBroker http://t.co/KGJW6Pboof
Correlations aren’t Constant by @ReformedBroker http://t.co/F2kNjjF1iw
Correlations aren’t constant per @ReformedBroker – great article today, brother. – http://t.co/2iuQYGvQtQ – REIT’s and #Treasuries. EXACTLY.
RT @SandiMartinSPF: “It’s frustrating to an unsophisticated investor when 3/4s of their portfolio is going up and 1/4 is going down” http:/…
#Correlations aren’t Constant … but they increase in down markets http://t.co/hmnKhtCv7Y
RT @ReformedBroker: Over the last 20 years, the S&P 500 has beaten all other asset classes just 30% of the time
http://t.co/ZMA4u87Klr
v…
RT @asibiza1: Remember, with recency comes forgetfulness… @ReformedBroker http://t.co/0ZaqdDjrWd
“This obsession with recency and forgetfulness of longer term results creates opportunity for patient investors.” http://t.co/To872cHzuH
RT @ReformedBroker: Over the last 20 years, the S&P 500 has beaten all other asset classes just 30% of the time
http://t.co/ZMA4u87Klr
v…
RT @ReformedBroker: Over the last 20 years, the S&P 500 has beaten all other asset classes just 30% of the time
http://t.co/ZMA4u87Klr
v…
RT @ReformedBroker: Correlations aren’t Constant http://t.co/5FONDZ0l85
Correlations aren’t Constant by @ReformedBroker http://t.co/rktdERFJha
RT @ReformedBroker: Over the last 20 years, the S&P 500 has beaten all other asset classes just 30% of the time
http://t.co/ZMA4u87Klr
v…