Jon Krinsky at MKM Partners mentions the fact that, to some extent, the S&P 500 has been correcting through time over the last six months – but perhaps that may not be good enough. In the meantime, although we’re still hanging in there above the (now-flattening) simple 200-day moving average, US large cap stocks are seeing a continued negative divergence in terms of sellers swamping buyers, beneath the surface.
Like all divergences, this one is worth considering although only secondarily to price itself, which remains constructive:
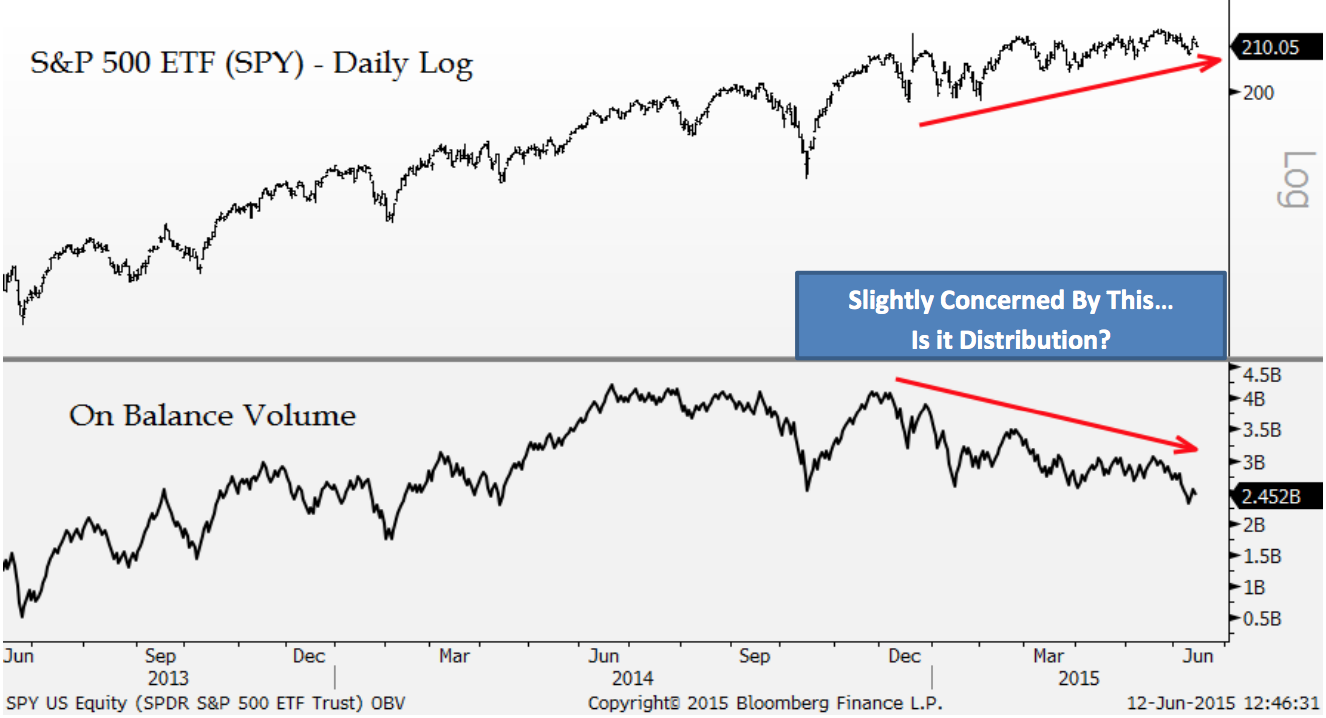
A Sign of Distribution?
Before we get to the positive message from the mid-caps, we wanted to highlight a small concern for the S&P 500 ETF (SPY). On Balance Volume, which is a simple cumulative measure of up volume vs. down volume, has been negatively diverging more most of 2015. This is certainly a concern, but as we have been harping on for weeks, it is difficult to act on this as long as price remains in an uptrend.
Josh here – it’s been awhile since I’ve heard anyone talking about “On Balance Volume” – it’s a great throwback to the time of Joe Granville, who popularized OBV back in the market-timers’ heyday of the late 1970’s / early-1980’s.
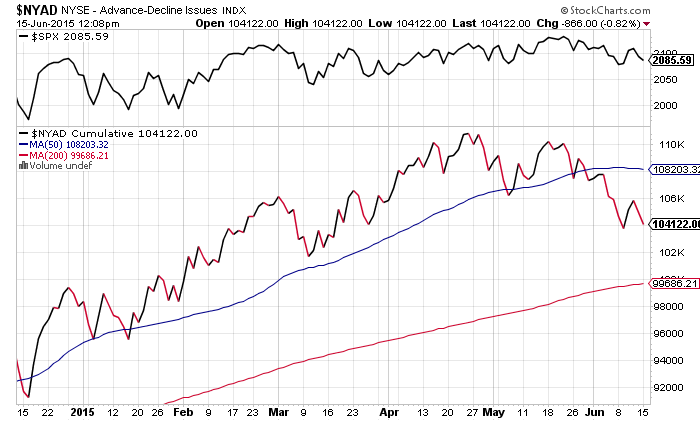
Jon’s chart confirms a similar divergence in the lack of confirmation between the S&P 500 price series and the advance/decline for the NYSE Composite. My own chart, below, depicts NYSE Composite below SPX price. You can see that breadth topped out in late April and appears to be leading price. Keep in mind, this is All Issues and not Stocks Only, so there are closed-ends and bond-related ETFs in the mix.
No matter how you want to look at it, more individual stocks are joining the correction list each week. Today, for example, there are 19 stocks on the NYSE trading at a new 52-week high and 95 at a new 52-week low. The new low list as of this morning includes Wal-Mart, Twitter, Goldcorp and Peabody Energy.
The objective observer would conclude that the situation is deteriorating, which points to a heightened chance of a correction through price, not just through time, should present trends continue.
I’m a New York City-based financial advisor at Ritholtz Wealth Management LLC. I help people invest and manage portfolios for them. For disclosure information please see here.
Get a Full Investor Curriculum: Join The Book List
Every month you'll receive 3-4 book suggestions--chosen by hand from more than 1,000 books. You'll also receive an extensive curriculum (books, articles, papers, videos) in PDF form right away.


… [Trackback]
[…] Find More to that Topic: thereformedbroker.com/2015/06/15/chart-o-the-day-more-sellers-than-buyers/ […]