Deutsche Bank is out with a piece of research this weekend mentioning the fact that the S&P 500 has just broken a record high thanks to a median trailing PE ratio of over 18 – the highest we’ve seen since 2010. They note that this PE ratio is 12% above the long-term average going back to 1960. The forward PE of 17.3 times earnings expectations over the coming four quarters is 22% above the historical median. David Bianco attributes this, as almost all of us do, to the incredibly low yields on bonds and their effect on the equity risk premium.
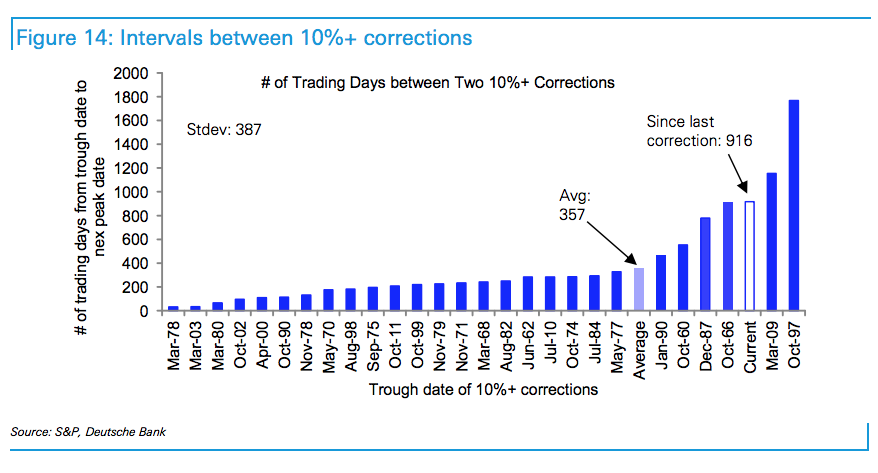
More interestingly, Bianco includes an acknowledgement that it has now been 916 days since the last 10% correction for the index, or 3.6 years (last October’s Ebola /ISIS sell-off was 9-and-change percent intra-day). We’ve not had even a 5% correction so far in 2015 despite a spate of elevated volatility earlier in the year.
Here’s David Bianco and Ju Wang:
We believe the probability of a 5%+ dip is high this summer and our tactical call remains Down given the S&P now at an even higher PE than a year ago, heightened uncertainty in 10yr yields, weak earnings growth and continued soft economic data. We haven’t had a 5%+ dip this year. Historically 5%+ dips are common and happen at least once a year since 1960, except 1964, 1993 & 1995. It has been 916 trading days (3.6 years) since a 10% correction. Selloff triggers could be a further rise in 10yr yields especially if UE keeps falling amidst slow economic growth and Fed remains unclear on first hike timing, or a jump in the dollar upon the Fed expressing firm intentions to hike in Sept.

Source:
S&P hits record high on 18 trailing PE, PE will be sensitive to Treasury yields
Deutsche Bank – May 22nd, 2015


RT @ReformedBroker: S&P now sells at the highest trailing PE since 2010, 916 days since the last 10% correction
http://t.co/ZBcaK7IXNN htt…
Three and a half years since the last 10% correction http://t.co/SQ29NJpn4U
RT @ReformedBroker: S&P now sells at the highest trailing PE since 2010, 916 days since the last 10% correction
http://t.co/ZBcaK7IXNN htt…
RT @ReformedBroker: S&P now sells at the highest trailing PE since 2010, 916 days since the last 10% correction
http://t.co/ZBcaK7IXNN htt…
RT @ReformedBroker: S&P now sells at the highest trailing PE since 2010, 916 days since the last 10% correction
http://t.co/ZBcaK7IXNN htt…
RT @hblodget: RT @ReformedBroker: S&P now sells at highest trailing PE since 2010, 916 days since 10% drop
http://t.co/SI2zOwglsr http://t…
RT @hblodget: RT @ReformedBroker: S&P now sells at highest trailing PE since 2010, 916 days since 10% drop
http://t.co/SI2zOwglsr http://t…
Three and a half years since the last 10% correction http://t.co/2res5MDHCH
Three and a half years since the last 10% correction…
http://t.co/zhXJm0XA9C
[…] Three and a half years since the last 10% correction “More interestingly, Bianco includes an acknowledgement that it has now been 916 days since the last 10% correction for the index, or 3.6 years (last October’s Ebola /ISIS sell-off was 9-and-change percent intra-day). We’ve not had even a 5% correction so far in 2015 despite a spate of elevated volatility earlier in the year.” […]
Three and a half years since the last 10% correction. Via @ReformedBroker http://t.co/HRtZAymAOq
I love that Deutsche Bank is making a “tactical call” based on a high P/E & soft economic data
http://t.co/fkYgkkBHDC via @ReformedBroker
So the last $SPX +10% correction was more than 916 trading days ago (3.5 years) http://t.co/SrfjbYJQiT Nuckin’ futs http://t.co/qI05ApS3Xz
RT @aguirrepujol: Three and a half years since the last 10% correction http://t.co/FLXxYajytg ver gráfico
Three and a half years since the last 10% correction http://t.co/FzbOYRF6X5 via @ReformedBroker