Lots of technicians I follow have been talking about the breakout to new all time highs this week in the S&P MidCap 400 index. It’s the first and only major average to make a new record high since the January correction that began the year.
Some collected thoughts…
JC Parets saw it coming and said so on February 4th:
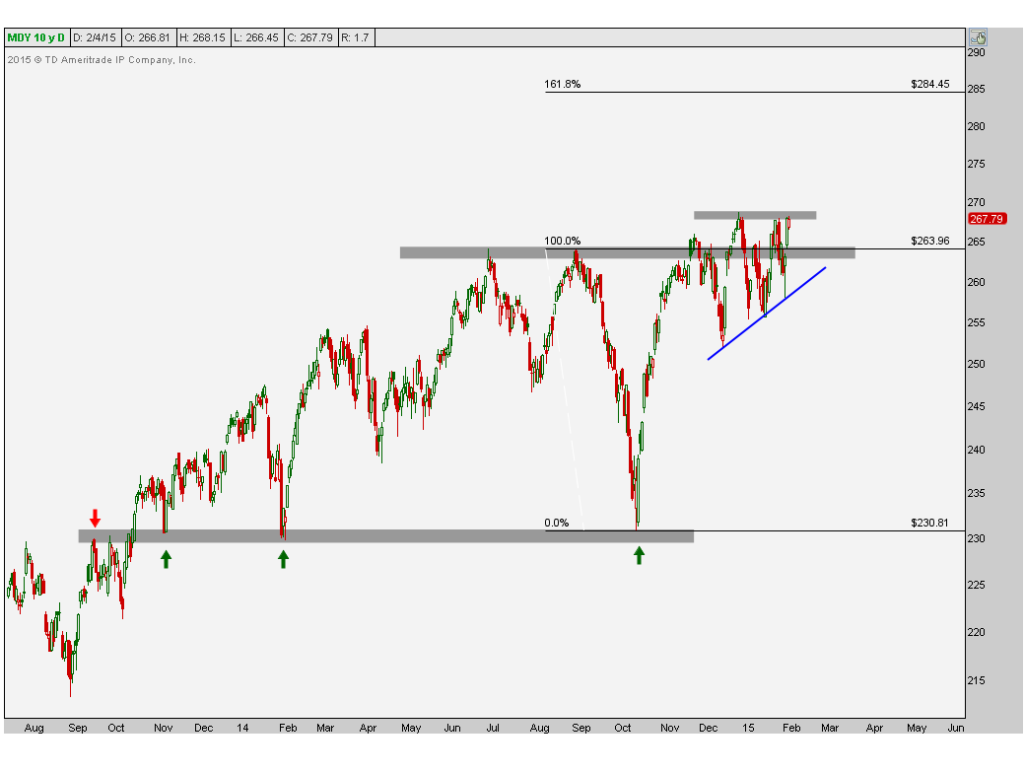
Here is a daily Candlestick chart looking at this consolidation over the past several months. I see higher lows and higher highs with very well-defined overhead supply. This is a name we want to own above all of this resistance. Above the December highs and there is nothing but blue skies. Our target based on this potential breakout would be up near 285 based on the 161.8% Fibonacci extension of the September/October decline. This represents about 6% of upside from current levels. I think we get a breakout soon and we want to be all over it.

Well, he was dead-on. The breakout happened within a few trading hours of this head’s up.
Joe Fahmy picked up on the idea of strength in the broad base of stocks that encompass the small and mid cap zone:
The S&P MidCap 400 Index made a new all-time high this past week. The Russell 2000 is putting in a nice year-long consolidation after its strong gains in 2013. These two indexes tend to be leading in nature (both to the upside and downside) and could see continued upside soon. In addition, all the major indexes had HUGE volume accumulation weeks last week, showing continued signs of institutional buying.
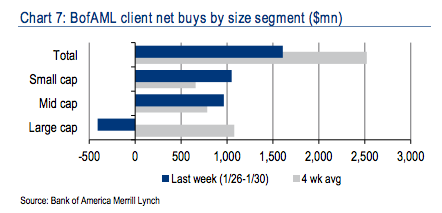
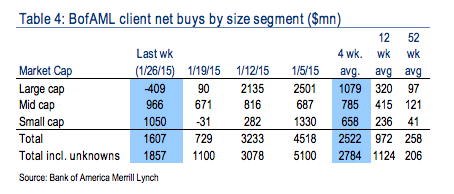
Elsewhere, the Equity and Quant Strategy Group within Bank of America Merrill Lynch noted that, while all of it’s clients became net buyers last week in the aggregate, 100% of the net buying occurred in small and mid cap stocks (emphasis mine):
Last week, during which the S&P 500 fell 2.8%, BofAML clients were net buyers of US stocks for the fourth week in the amount of $2.0bn. Both private and institutional clients were net buyers for the fourth and eighth consecutive weeks, respectively, while hedge funds were net sellers for the second week. Net buying was entirely in mid and small caps; in fact, net buying of mid-caps was the largest since August ‘09. Buybacks by corporate clients ticked up to their highest level so far this year, led by Tech, and to their highest level since August on a four-week average basis.

What’s driving the outperformance and new all-time highs of the mid cap names?
Mike Harris at Price Action Lab attributes it to simple index composition, noting the relatively small amounts of troubled sectors within (emphasis mine):
With a close at 1,482.04, the MidCap Index registered a new all-time high close above the previous such high of December of last year at 1,478.22.
The MidCap Index three largest sector weightings are 24.2% for Financials, 17.6% for IT and 14.9% for Industrials. The Energy sector has a weight of only 3.9% and, as a result, the impact from the decline in energy prices has minimum adverse effect on this index.
This new-all time high in the MidCap index may be a leading indicator of new all-time highs to follow in S&P 500, NASDAQ and Russell 2000 indexes.
The bottom line is that investors are getting more selective about what they’ll own and choosing a focus on US-oriented companies with minimal energy exposure. Whether or not this magnanimity will extend itself to the more multi-national, energy-laden S&P 500 in the coming days is up for debate, but history says a large cap catch-up is more likely than not.
If you believe at all that internals are a good indicator in the health of a market price trend, then broad participation in areas beneath the mega-cap names is a big positive.


RT @ReformedBroker: WHY MIDCAPS BROKE OUT
http://t.co/QftWU5ZQzV $IJH $MDY
starring @jfahmy @allstarcharts @mikeharrisNY
RT @ReformedBroker: WHY MIDCAPS BROKE OUT
http://t.co/QftWU5ZQzV $IJH $MDY
starring @jfahmy @allstarcharts @mikeharrisNY
RT @ReformedBroker: WHY MIDCAPS BROKE OUT
http://t.co/QftWU5ZQzV $IJH $MDY
starring @jfahmy @allstarcharts @mikeharrisNY
RT @ReformedBroker: WHY MIDCAPS BROKE OUT
http://t.co/QftWU5ZQzV $IJH $MDY
starring @jfahmy @allstarcharts @mikeharrisNY
RT @ReformedBroker: WHY MIDCAPS BROKE OUT
http://t.co/QftWU5ZQzV $IJH $MDY
starring @jfahmy @allstarcharts @mikeharrisNY
Why Midcaps Broke Out… (http://t.co/4DeeqUIIRn)
RT @ReformedBroker: WHY MIDCAPS BROKE OUT
http://t.co/QftWU5ZQzV $IJH $MDY
starring @jfahmy @allstarcharts @mikeharrisNY
RT @ReformedBroker: WHY MIDCAPS BROKE OUT
http://t.co/QftWU5ZQzV $IJH $MDY
starring @jfahmy @allstarcharts @mikeharrisNY
RT @ReformedBroker: WHY MIDCAPS BROKE OUT
http://t.co/QftWU5ZQzV $IJH $MDY
starring @jfahmy @allstarcharts @mikeharrisNY
RT @ReformedBroker: WHY MIDCAPS BROKE OUT
http://t.co/QftWU5ZQzV $IJH $MDY
starring @jfahmy @allstarcharts @mikeharrisNY
RT @ReformedBroker: WHY MIDCAPS BROKE OUT
http://t.co/QftWU5ZQzV $IJH $MDY
starring @jfahmy @allstarcharts @mikeharrisNY
RT @ReformedBroker: WHY MIDCAPS BROKE OUT
http://t.co/QftWU5ZQzV $IJH $MDY
starring @jfahmy @allstarcharts @mikeharrisNY
“@ReformedBroker: WHY MIDCAPS BROKE OUT
http://t.co/Lg44K1IS2Q $IJH $MDY
starring @jfahmy @allstarcharts @mikeharrisNY”@pennyjgo
RT @ReformedBroker: WHY MIDCAPS BROKE OUT
http://t.co/QftWU5ZQzV $IJH $MDY
starring @jfahmy @allstarcharts @mikeharrisNY
RT @ReformedBroker: WHY MIDCAPS BROKE OUT
http://t.co/QftWU5ZQzV $IJH $MDY
starring @jfahmy @allstarcharts @mikeharrisNY