Research Affiliates’ Chris Brightman is out with a piece dealing with their return expectations over the next ten years. In the course of making their assumptions, RA takes a look back at the last ten years and calculates the annualized return of a classic 60% equity / 40% fixed income portfolio versus 16 pure asset classes on their own. The 60/40 portfolio generated 7.2% annual returns (nominal) from 2005 through the end of 2014, edging out 9 of the 16 asset classes in their data set and with significantly less volatility than most as well.
In the chart below, Brightman plots these returns on the Y axis with standard deviation (a measure of vol) along the X axis. The annualized returns below are in real (inflation-adjusted) terms:
A few things to bear in mind: Compounding at 7.2% a year doubles the value of your portfolio in the span of a decade. According to my own calculations, $10,000 turns into $20,042.31 before fees at this rate of return, not too shabby. But now consider the fact that this period, between 2005-2014, encompasses one of the worst stock market crashes and economic downturns in history. The 100-year annualized rate of return for the classic 60/40 portfolio is actually higher – RA calculates it as 8.4% (an amalgam of 10.3% annual stock returns and 5.6% for US bonds).
At my wealth management firm, when people ask us about the latest hot fund or manager or asset class or strategy – and whether or not it’s worth allocating toward them – we’ll sometimes turn the question around: “If we know we have something that works, does it make sense to replace it with something that may or may not?”
Are there better ways to invest than the classic 60/40? Sure there are. Will you be able to identify them in advance? Can you bear the added risk of a portfolio tilted toward higher expected returns, through the really rough times where that extra return is actually earned? What are the costs associated with supposed “better” investment strategies? Can they be justified on an after-tax, net of transaction expense basis?
Those questions are probably some pretty high hurdles for a lot of the so-called “better” or more exciting strategies to surmount, no?
I’m a New York City-based financial advisor at Ritholtz Wealth Management LLC. I help people invest and manage portfolios for them. For disclosure information please see here.
Get a Full Investor Curriculum: Join The Book List
Every month you'll receive 3-4 book suggestions--chosen by hand from more than 1,000 books. You'll also receive an extensive curriculum (books, articles, papers, videos) in PDF form right away.

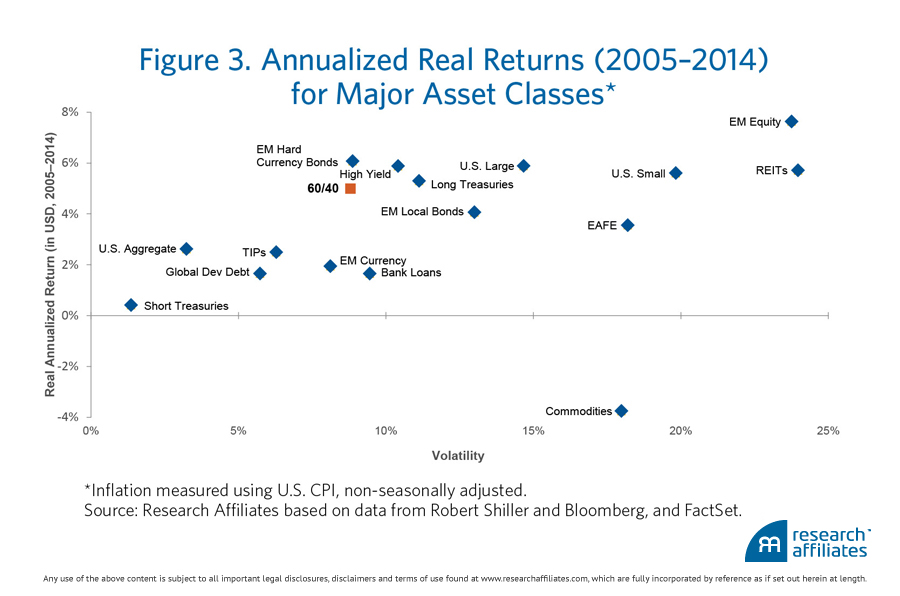


Chart o’ the day: triumph of the classic 60/40 http://t.co/Zf1h3xwKLr
[…] Triumph of the classic 60/40 split – The Reformed Broker […]
[…] On the triumph of the boring 60/40 portfolio. (thereformedbroker.com) […]
RT @InvestSensibly: Why the constant search for new, “better” investment strategies when there are proven ones that work? @ReformedBroker h…
RT @InvestSensibly: Why the constant search for new, “better” investment strategies when there are proven ones that work? @ReformedBroker h…
[…] The Reformed Broker, investment manager Research Affiliates shares how a simple, balanced 60/40 portfolio (specifically […]
[…] The Reformed Broker, investment manager Research Affiliates shares how a simple, balanced 60/40 portfolio (specifically […]
… [Trackback]
[…] Read More on that Topic: thereformedbroker.com/2015/01/22/chart-o-the-day-triumph-of-the-classic-6040/ […]
… [Trackback]
[…] Here you can find 13330 additional Info to that Topic: thereformedbroker.com/2015/01/22/chart-o-the-day-triumph-of-the-classic-6040/ […]
… [Trackback]
[…] Read More Info here to that Topic: thereformedbroker.com/2015/01/22/chart-o-the-day-triumph-of-the-classic-6040/ […]
… [Trackback]
[…] Find More to that Topic: thereformedbroker.com/2015/01/22/chart-o-the-day-triumph-of-the-classic-6040/ […]
… [Trackback]
[…] Find More Info here on that Topic: thereformedbroker.com/2015/01/22/chart-o-the-day-triumph-of-the-classic-6040/ […]
… [Trackback]
[…] Read More on to that Topic: thereformedbroker.com/2015/01/22/chart-o-the-day-triumph-of-the-classic-6040/ […]
… [Trackback]
[…] Read More Info here on that Topic: thereformedbroker.com/2015/01/22/chart-o-the-day-triumph-of-the-classic-6040/ […]
… [Trackback]
[…] Read More on that Topic: thereformedbroker.com/2015/01/22/chart-o-the-day-triumph-of-the-classic-6040/ […]