
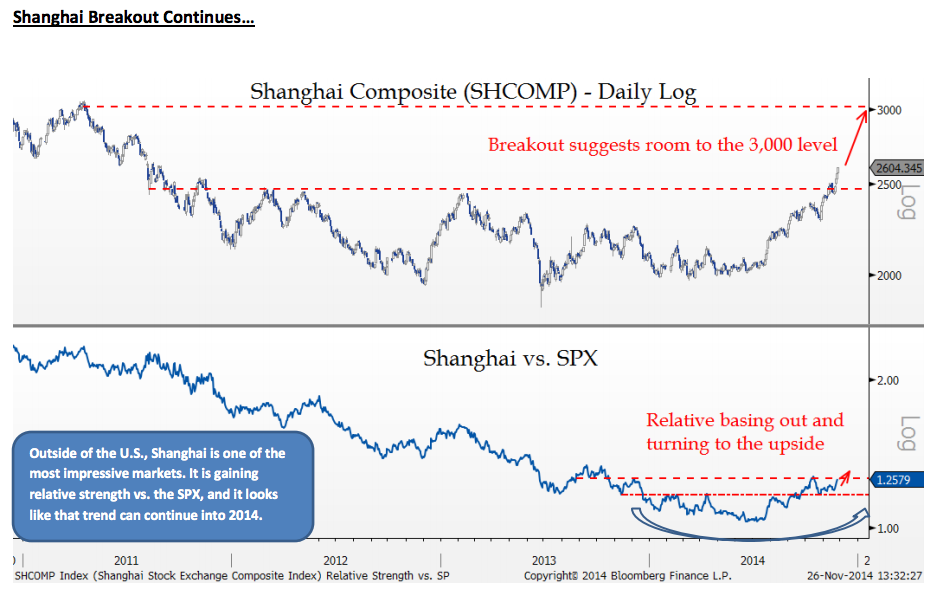
Don’t tell anyone, but so far this year the Chinese stock market – as represented by the Shanghai Composite – is now up almost 30% or double the year-to-date gain in the S&P 500. It’s outpaced the gains for the Hong Kong market by almost triple. The technical base put in by Chinese stocks has been years in the making. And now, as my friend Jon Krinsky (MKM Partners) shows, it’s breaking out in both relative and absolute terms in a very obvious way:
Josh here – the fundamentals behind this move are pretty obvious. Beijing announced a raft of new economic and market reforms in the last month while, at the same time, cutting deposit rates at the banks to show that they’re serious about preserving their 7.5% GDP growth target. In the meantime, the stock market connection between mainland exchanges (Shanghai-Shenzhen) with Hong Kong have meant a narrowing of the discounts between the two markets and a brand new interest in the space from global portfolio managers. As initial interest blossoms (and is rewarded), fund flows follow. You’re seeing this play out in the charts as we speak. China is getting hot again as a theme for the first time in what feels like years.
Jon points out that seasonally, December has been the best month for the Shanghai, averaging almost 4% annually over the last decade. He points to FXI, the popular ETF of Hong Kong stocks listed in London as a possible way to play this, but I would look at the Kranshares product KBA as an alternative. KBA is one of the only vehicles that allow US investors to access mainland Chinese stocks and is probably more of a pure play if you believe in the breakout continuing.
Source:
Weekly Technical Strategy
MKM Partners – November 30th, 2014


… [Trackback]
[…] There you will find 65767 additional Info on that Topic: thereformedbroker.com/2014/12/01/chart-o-the-day-here-comes-china/ […]
… [Trackback]
[…] Find More on on that Topic: thereformedbroker.com/2014/12/01/chart-o-the-day-here-comes-china/ […]
… [Trackback]
[…] Info on that Topic: thereformedbroker.com/2014/12/01/chart-o-the-day-here-comes-china/ […]
… [Trackback]
[…] Information to that Topic: thereformedbroker.com/2014/12/01/chart-o-the-day-here-comes-china/ […]
… [Trackback]
[…] Find More Info here to that Topic: thereformedbroker.com/2014/12/01/chart-o-the-day-here-comes-china/ […]
… [Trackback]
[…] Information to that Topic: thereformedbroker.com/2014/12/01/chart-o-the-day-here-comes-china/ […]
… [Trackback]
[…] Find More to that Topic: thereformedbroker.com/2014/12/01/chart-o-the-day-here-comes-china/ […]
… [Trackback]
[…] Find More on to that Topic: thereformedbroker.com/2014/12/01/chart-o-the-day-here-comes-china/ […]
… [Trackback]
[…] Read More Information here on that Topic: thereformedbroker.com/2014/12/01/chart-o-the-day-here-comes-china/ […]
… [Trackback]
[…] Find More on to that Topic: thereformedbroker.com/2014/12/01/chart-o-the-day-here-comes-china/ […]
… [Trackback]
[…] There you can find 3188 more Info to that Topic: thereformedbroker.com/2014/12/01/chart-o-the-day-here-comes-china/ […]
… [Trackback]
[…] Find More on that Topic: thereformedbroker.com/2014/12/01/chart-o-the-day-here-comes-china/ […]