
“Does a great year for stocks in 2013 bode well for 2014? History says yes! Or no! It depends!”
This is one of the most common types of stories we read on the financial web each January. Every author uses a different data series of years or indices or whatever to make their case. Derek Tomczyk tackled the topic a week ago and looked at the market’s tendency to keep rallying after an exceptionally strong year. More importantly, we learn something surprising about how common 12-month rallies of 20% or more actually are when we move away from measuring them on a calendrical cycle.
With the author’s permission, we publish his findings below as a guest post. I hope you enjoy!
– Josh
***
Derek Tomczyk is the managing director of Optionize Inc an organization dedicated to option based long term investing strategies. With a probabilistic approach to investing he’s less concerned with point estimates and more with looking for an edge where other investors underestimate the odds.
After a great year for the S&P 500 (SPY) in 2013, it’s natural to wonder whether that type of pace can be maintained going forward into next year. The forecasts for 2014 are starting to come out and people seem to fit into one of two camps. In one corner is the mean reversion crowd that feels we cannot follow a year like 2013 with another very strong year; the best we can hope for is a flattish year with the possibility of giving up some of the 2013 gains. In the other corner is the crowd that thinks momentum will propel stocks even higher in 2014. While this crowd thinks 2014 will be a positive year, they generally think the chances of a repeat of 2013 are very low. They believe the stock market will run for a bit on the momentum built up in 2013 but eventually run out of steam and decelerate or perhaps decline. I decided to take a look at what the historical record can tell us about the odds for this year given last years performance.
The momentum crowd sometimes correctly points out that great years are often followed by other great years. The following table illustrates this argument:
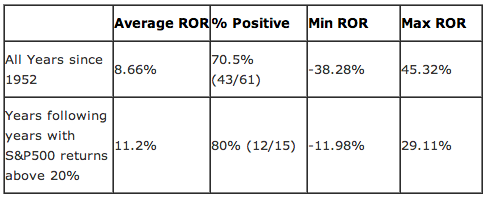
The above statistics seem to show that given a preceding year of returns above 20%, the following year has a significantly higher chance of being positive and a higher expected return than it would otherwise have. It even appears that it should have slightly less volatility in those returns. This seems to validate the momentum crowd in that years following years with 20%+ returns appear to be stronger than just an average year. I’ve already read many articles pointing this out as an argument to stay invested or even increase exposure. It’s too bad the above analysis is faulty.
While price action itself should not be the only determinant in the investment process I am not against looking at the historical record and calculating odds to determine reasonability. However, the problem with the above analysis is two fold. First, the sample size is too low, and secondly, it’s cherry picking the 12 month periods. There is nothing special about investing from January to December. If we want to get the odds of a 12 month period return following a another strong 12 month period we need to look at all the overlapping periods starting on any day of the year. To illustrate why, consider that the 12 month return using Dec 31, 2012 as a starting point is 32% while if we use Jan 4, 2013 (ending Jan 4, 2014) as the starting point it is 25%. The difference of just a few days changes the single data point for 2013 by a significant amount if using calendar years. In order to determine the true 12 months odds both 12 month returns have to be considered equally likely. The use of overlapping periods also conveniently gives us a larger sample to work with.
The following table illustrates the returns for the entire set of 12 month overlapping periods since 1952:
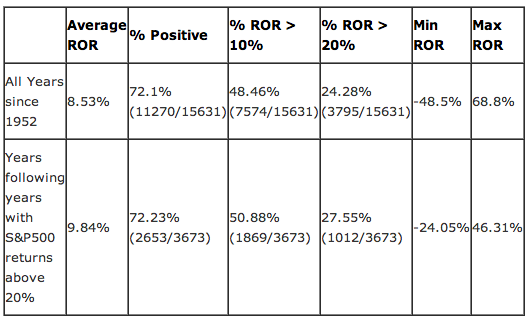
The odds advantage of having a positive year following a 20%+ return year has now completely disappeared. The chances of 2014 being positive given the 2013 return > 20% are exactly the same as the chances of 2014 being positive without knowing the 2013 return.
While not quite as significant as before, the average ROR is still larger when a previous year was a strong year. This may seems confusing since the odds of a positive return have not changed but it’s because the outperformance does not come from the probability for relatively flat or low return. The outperformance comes from the probability for another great year in that the chances of a 20%+ year are significantly higher if the previous year was a 20%+ return year.
To summarize, when looking at historical odds, it seems both camps are wrong. The mean reversion camp is wrong since the odds of a positive return following a 20%+ year are exactly the same as any other year. The momentum crowd is wrong because the chances for a positive, but much lower return for 2014 then 2013 are actually very similar to any other year as well. The only statistically significant signal that can be glimpsed from the historical record is that if there is a positive year in 2014 the odds for a 20%+ year are actually better than average. What may also surprise many of the readers of this article is how common a 20%+ return 12 month period is in general. With a 1-in-4 chance of getting a 20%+ return when investing money on any random day it puts in perspective that while 2013 was great it is not as unusual as many think.
***
Thanks, Derek!


… [Trackback]
[…] There you will find 60213 additional Information on that Topic: thereformedbroker.com/2014/01/23/the-truth-about-momentum-and-calendar-year-returns/ […]
… [Trackback]
[…] Here you can find 99879 additional Info to that Topic: thereformedbroker.com/2014/01/23/the-truth-about-momentum-and-calendar-year-returns/ […]
… [Trackback]
[…] Information on that Topic: thereformedbroker.com/2014/01/23/the-truth-about-momentum-and-calendar-year-returns/ […]
… [Trackback]
[…] Information to that Topic: thereformedbroker.com/2014/01/23/the-truth-about-momentum-and-calendar-year-returns/ […]
… [Trackback]
[…] Find More on on that Topic: thereformedbroker.com/2014/01/23/the-truth-about-momentum-and-calendar-year-returns/ […]
… [Trackback]
[…] Read More Information here on that Topic: thereformedbroker.com/2014/01/23/the-truth-about-momentum-and-calendar-year-returns/ […]
… [Trackback]
[…] Here you can find 2979 more Info to that Topic: thereformedbroker.com/2014/01/23/the-truth-about-momentum-and-calendar-year-returns/ […]
… [Trackback]
[…] Find More to that Topic: thereformedbroker.com/2014/01/23/the-truth-about-momentum-and-calendar-year-returns/ […]
… [Trackback]
[…] Find More Information here to that Topic: thereformedbroker.com/2014/01/23/the-truth-about-momentum-and-calendar-year-returns/ […]
… [Trackback]
[…] Information on that Topic: thereformedbroker.com/2014/01/23/the-truth-about-momentum-and-calendar-year-returns/ […]
… [Trackback]
[…] Find More Information here to that Topic: thereformedbroker.com/2014/01/23/the-truth-about-momentum-and-calendar-year-returns/ […]
… [Trackback]
[…] There you can find 28186 more Information on that Topic: thereformedbroker.com/2014/01/23/the-truth-about-momentum-and-calendar-year-returns/ […]