I have a pair of charts here that pose an interesting question – are Vanguard investors smarter than iShares investors?
Since the beginning of this year, emerging markets as an asset class have outperformed the US stock market by almost 3 to 1. This has left many investors who are under-allocated to EM in catch-up mode. But not all investors.
When we compare ETF assets under management to share price for the two largest EM funds – iShares’s EEM and Vanguard’s VWO – we see two very different patterns of investor behavior.
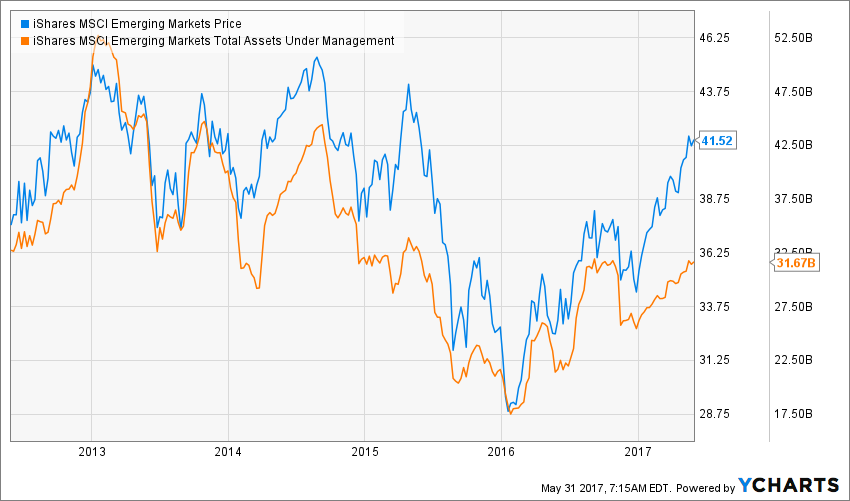
Let’s look at the iShares product, EEM, which costs a lot more than Vanguard’s and distinguishes itself by being based on the popular MSCI EM index. The first thing you’ll notice is that assets under management (orange line) of $31 billion are down significantly from their peak of $52 billion. EEM’s assets have fallen almost 40% since the start of 2013 while the ETF’s returns (blue line) were only down slightly since then.

Investors were heavily allocated just before a five year stretch of dreadful performance and then were totally underinvested at the bottom, with only $17.5 billion invested in EEM at the start of 2016.
This is a great illustration of how even so-called passive investors underperform their own investments, almost systematically. If you want to keep from throwing up, make sure you never look at a fund’s dollar-weighted returns. They are always worse than a fund’s published price returns, which almost no one actually earns.
But when we look at Vanguard’s competing VWO product, the world’s most popular emerging market ETF, we see a somewhat different picture…
In the chart below, you’ll see that VWO’s assets under management (orange) are actually leading the performance of the fund (blue) over the last five years:

Let me break down what’s going on here. VWO’s ETF assets only (the fund is classified as a share class of Vanguard’s identical mutual fund) are $52 billion. This is actually 17% higher than where they were five years ago versus a returns of just 8% for the ETF. Holders of VWO have been much steadier in terms of allocating to the asset class and in the last six months they’ve actually been front-running the returns with their purchases. It’s notable that they’ve been doing so even as iShares holders have fallen way behind.
Now, a head to head AUM comparison, expressed in percentage terms from the beginning of the five-year period:

Two things should jump out at you – first, Vanguard’s AUM (blue) has been much less volatile and iShares (orange) has lost a lot of ground.
A few possible explanations for this disparity:
1. Vanguard investors are better behaved and have been sticking to a percentage allocation plan in their portfolios while iShares users have been more sensitive to the recency bias. This is because they are different tribes of people with different behavioral characteristics.
or
2. Users of iShares EEM are more likely to be tactical managers, traders and hedge funds because the product offers high daily trading volume and liquidity. Vanguard users are more likely to be hands-off Bogleheads who commit to doing as little as possible each year and pay scant attention to capital markets.
or
3. Some of the investors who had previously been using EEM in 2012, 2013, 2014 have converted to Vanguard investors and are now making their decisions primarily on cost – EEM is 69 basis points while VWO is just 14 basis points. People care less about index construction and more about cost than they did five years ago – or they’ve developed an affinity for the Vanguard brand. Or both.
or
4. Vanguard does a better job at investor / advisor education than iShares and so the users of its ETF have had the discipline to add more to the asset class as it underperformed than the iShares user base.
or (UPDATED)
5. An astute reader mentioned that a preference for IEMG, a somewhat competitive iShares core EM product, has taken center stage in the EM lineup. It’s had rapid AUM growth YTD. IEMG costs about a third of what its stablemate EEM costs (just 18 basis points) so it’s more akin to a Vanguard product than a BlackRock product. This would augur well for the argument that cost is driving all of this. A chart of AUM growth below:

And here’s the AUM cannibalization chart of IEMG vs EEM, which is astounding in percentage growth terms:

I would argue that answer to this puzzle could be any of these things or a combination of some / all of them.
What do you think? Let us know on twitter @ritholtzwealth !


… [Trackback]
[…] Find More Info here on that Topic: thereformedbroker.com/2017/05/31/are-vanguard-investors-smarter-than-ishares-investors/ […]
… [Trackback]
[…] Information on that Topic: thereformedbroker.com/2017/05/31/are-vanguard-investors-smarter-than-ishares-investors/ […]
… [Trackback]
[…] Read More Info here to that Topic: thereformedbroker.com/2017/05/31/are-vanguard-investors-smarter-than-ishares-investors/ […]
… [Trackback]
[…] There you will find 35607 additional Information on that Topic: thereformedbroker.com/2017/05/31/are-vanguard-investors-smarter-than-ishares-investors/ […]
… [Trackback]
[…] Information on that Topic: thereformedbroker.com/2017/05/31/are-vanguard-investors-smarter-than-ishares-investors/ […]
… [Trackback]
[…] Info on that Topic: thereformedbroker.com/2017/05/31/are-vanguard-investors-smarter-than-ishares-investors/ […]
… [Trackback]
[…] Read More Information here to that Topic: thereformedbroker.com/2017/05/31/are-vanguard-investors-smarter-than-ishares-investors/ […]
… [Trackback]
[…] Read More Info here on that Topic: thereformedbroker.com/2017/05/31/are-vanguard-investors-smarter-than-ishares-investors/ […]
… [Trackback]
[…] Information on that Topic: thereformedbroker.com/2017/05/31/are-vanguard-investors-smarter-than-ishares-investors/ […]
… [Trackback]
[…] There you will find 808 more Information to that Topic: thereformedbroker.com/2017/05/31/are-vanguard-investors-smarter-than-ishares-investors/ […]
… [Trackback]
[…] Read More Info here to that Topic: thereformedbroker.com/2017/05/31/are-vanguard-investors-smarter-than-ishares-investors/ […]