My friend Jon Krinsky, technical analyst at MKM Partners, has been killing it with some really key charts lately – many of which I’ve been featuring here on TRB. No one has ever been able to pick a market top using fundamentals, but technicals can sometimes offer clues toward trend changes in buyer/seller behavior at key turning points.
Many of my technically-inclined friends were bearish at the end of 2007, regardless of the “sub prime is contained” talk coming from the majority of fundamental analysts, many of whom were more focused on earnings valuations – which were very reasonable – prior to the collapse.
Anyway, Jon’s recent piece highlights the major technical difference between the stock market today and in 2007 by digging beneath the surface of price and taking a look at the internal dynamics. This is very important stuff to be aware of in my opinion.
Given the fact that the current rally is exactly five years old, and up 181% off the 2009 lows, it is certainly enticing to look for a major “cyclical top.” When we look at the current market set-up, however, we just don’t see those signs right now.
The lack of a cyclical top stems from several key reasons:
1) Breadth
2) Trend
3) Leadership/rotationBreadth
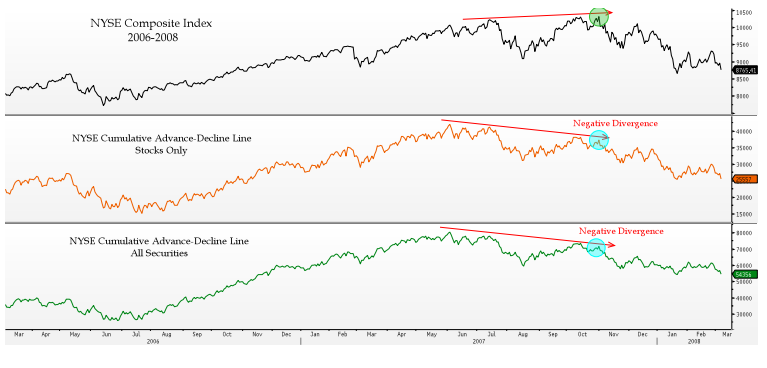
In our view, cumulative advance-decline lines are one of the better long-term breadth measures to observe. As you can see below, at the 2007 peak, even as stock prices (NYSE Index) were making new highs in October, the cumulative advance-decline lines had already peaked four months prior, and were clearly in a downtrend.
Below, Krinsky’s chart demonstrates the negative divergence in advance-decline that signaled the 2007 top – yes, markets were making new high, but there were less stocks participating and the rally had become more and more concentrated. This is a classic tell that a bull run is exhausted.

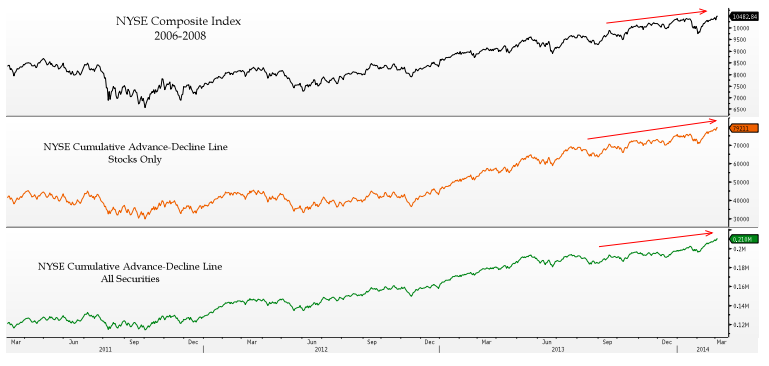
Now here’s the same chart today, notice the confirmation emanating from fresh breakouts in the advance-decline…

Jon tackles Trend and Leadership in the report, concluding that while we’re definitely overextended (326 days above the 200-day moving average in the S&P 500), the technicals do not at all suggest that we’ve reached a 2007-like top. If anything, strength in these measures augurs well for continued strength, even if a retest of the breakout level is coming soon.
Source:
Bull Market Turns Five… But No Signs of Cyclical Top
MKM Partners – March 6th, 2014


… [Trackback]
[…] Information on that Topic: thereformedbroker.com/2014/03/06/the-2007-top-vs-today/ […]
… [Trackback]
[…] Find More to that Topic: thereformedbroker.com/2014/03/06/the-2007-top-vs-today/ […]
… [Trackback]
[…] Read More on that Topic: thereformedbroker.com/2014/03/06/the-2007-top-vs-today/ […]
… [Trackback]
[…] There you can find 48398 more Info to that Topic: thereformedbroker.com/2014/03/06/the-2007-top-vs-today/ […]
… [Trackback]
[…] Find More Information here on that Topic: thereformedbroker.com/2014/03/06/the-2007-top-vs-today/ […]
… [Trackback]
[…] Find More to that Topic: thereformedbroker.com/2014/03/06/the-2007-top-vs-today/ […]
… [Trackback]
[…] Information to that Topic: thereformedbroker.com/2014/03/06/the-2007-top-vs-today/ […]
… [Trackback]
[…] Read More to that Topic: thereformedbroker.com/2014/03/06/the-2007-top-vs-today/ […]