
A new year has just begun, let’s get our bearings…
This isn’t a post full of table-pounding predictions or forecasts, this is just me thinking out loud. In the first part, I’ll sum up the current environment as I see it. In the second part, I’ll talk about some possible scenarios for the coming year that, to me, would seem to be the most likely. In Part III I’ll bottom line it for you.
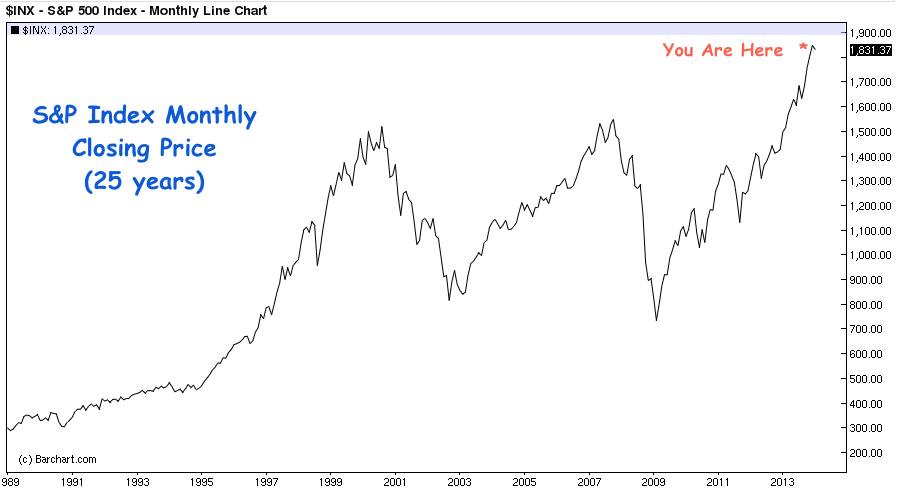
The below commentary will be chart-free because I believe we are over-charted in general and I want this to be a thinking exercise rather than a looking one.
Before I begin, I’d ask you to keep the following in mind:
First, the portfolios we manage for clients are typically comprised of multiple style components, some of which are strategic and some are tactical. Our prime directives are to keep costs low, keep decision-making to a minimum and do as little reactionary trading as possible. That said, stoicism and awareness mustn’t necessarily be mutually exclusive; we are regularly monitoring our three most important factors – Valuation, Sentiment and Trend – to determine our strategic weightings and tilts.
Second, while I claim no ability to predict the future, well, I’ve gotten you this far. In January of 2012 I begged you to get your shit together for the new post-crisis reality and at the beginning of 2013 we broke out of the Fear Factory together. We all have our own heuristics through which we examine the present and make mental models of what is to come. I’ve been fortunate (lucky?) to have mostly selected the right things to pay attention to in the recent past. I’m fully aware of the possibility that this may not persist going forward.
Okay, so with those two caveats in place, let’s get down to business.
Part I: Where We Stand
The first thing you need to know is that there are less opportunities in the stock market than there were one year ago and significantly less than there were during the year prior.
This is a fact. I’m not calling a market top, or saying investors in US stocks can’t make money from here or even that we’re closer to the end of this run than the beginning. But my side of the street is now more crowded, even the pessimists have given themselves over to the game, reluctantly but definitively. Sentiment is embarrassing at this point. And the academic research tells us that investors are extrapolative in nature, meaning they tend to expect even more gains following a good year. Never mind that this is precisely backwards…
The one thing we know about investor behavior for a fact is that flows don’t follow “value” or “opportunity”, they follow performance. Trust me on this one. Investors drive using their rearview mirrors because the human animal loves certainty and its brain emphasizes recently detected patterns as though they somehow represent a permanent state of play.
We now have stocks showing double-digit average annual returns on a trailing five-year basis. This is precisely the datapoint upon which future asset allocation decisions will be made in brokerage firm conference rooms and committee meetings from Toronto to Tallahassee, Manhattan to Manhattan Beach. Financial advisors to individuals, retirement plans and pensions will all be baking these five-year return figures into their models and proposals as they gather new assets. The pitch will become stock-centric once again as bonds and gold look, comparatively speaking, like absolute ass.
Valuations are rich across the board, though not egregiously rich yet, and there are many pockets of speculative extremes across several industry groups.
Much digital ink has been spilled about valuations over the last few years, almost all of it completely biased. Bears who’ve missed the rally or bet against it will use the cyclically adjusted PE ratio covering the last ten years worth of earnings (aka CAPE) to make their “stocks are overvalued” case. Perma-bulls or those looking to gather equity assets will instead use forward PE ratios or the Fed Model to show that stocks are moving up commensurate with profit growth or that we’re still cheap relative to bonds.
They’re all full of it, or course, talking their books and saying the things they’re being paid or expected to say, depending on their firm, job title and portfolio positioning. Any idiot can collect every single negative data point and pile them up into a 90-page PDF just as my seven year old daughter knows how to comb the web for all the positive facts while discarding all the icky ones. This type of mosaic analysis almost always hinges on what items one chooses to leave off the list – avoid this kind of thing like the plague, it’s dumb.
The reality is that we’re on the high-side of historic valuations based on earnings and getting more expensive every month. The major averages are nowhere near real bubble territory yet, despite the fact that they seem hellbent on getting there. We’re an expensive market based on Warren Buffett’s preferred yardstick, total market cap as a percentage of gross national product and we’re also expensive relative to almost every other country’s stock market around the world.
But so what? When have you ever seen a bull market stop at fair value? They always overshoot. I’m not saying this is good or it’s bad, I’m saying it just is. Jeff Kleintop at LPL Financial has been saying that most bull markets peak out around 17-18 times earnings and we’re not quite there yet (give it a few days, LOL).
Also, the next time you hear someone say we’re overdue for a correction, ask them for a copy of the schedule. Unfortunately, markets are biological rather than mechanical in nature and, as such, precision in timing is nowhere to be found.
According to the research of Dow Jones Index’s John Prestbo, we’ve had 27 corrections of more than 10% that did not turn into full-blown bear markets in the post-WWII period. That’s an average of one 10% or more correction roughly every 20 months, but this average does not mean they’re evenly spaced out. Over the last 66 years, a full quarter of these sell-offs had occurred during the 1970′s (the Golden Age of Market Timers) and another 20% occurred during the “lost decade” of 2000-2010. In other words, almost half of all 10% or greater corrections took place in the context of a secular bear market cycle.
Those who’ve been waiting for this “regularly scheduled” washout have been waiting in vain. The S&P 500 has spent the past 14 months above its 200-day moving average or almost 300 consecutive trading sessions according to my friend Jon Krinsky, the technical analyst at MKM Partners. Jon tells us this is the 7th longest such streak since 1980.
Bespoke Investment Group has been keeping a chart of the recent rally since the Fall 2011 lows versus all prior rallies that made it this far since 1928. They note that the current bull run is among the great ones in terms of length, but it is by no means a record-breaker. Justin and Paul point out that from March 2003 to October 2007 – basically the entirety of that cyclical bull market – the S&P ran on for 1,153 trading days without so much as a 10% correction. But that’s not even the longest rally ever, the October 1990 to October 1997 streak is: 1,767 trading days without a 10% correction.
Can you imagine seven years of guys going “we’re overdue for a correction” again and again? Thank god there was no fucking Twitter back then.
By the way, to break that 1990-1997 longevity record, we’d have to run on through October of 2018, another five years without a sell-off. That would be, well, banoodles.
To bring things back to the recent past, however, let’s consider the work of Brian Gilmartin of Trinity Asset Management, who has just taken a look at all of the dips and corrections since the secular bear market low in March of 2009. He tabulates just six such episodes, ranging in severity from the Taper Tantrum’s 7.5% drop this past May to the 21.5%, 20-week long affair in mid-2011 that encompassed the ECRI recession call, the European meltdown and the debt ceiling crisis.
Gilmartin calculates that the average price drop for the S&P during these six events has been roughly 12.5%, the average duration is something like 8 or 9 weeks and they’ve been growing increasingly benign. Unfortunately, investor sentiment has been turning nasty on a dime even as the dips have lessened, demonstrating a decreasing wherewithal amongst market participants for volatility of any sort. This sort of kneejerk sentiment drop at the first hint of trouble is precisely what can lead to overreactions when the real thing comes along.
Part II: Four Potential Scenarios
So what now?
I envision the following four scenarios being the most likely, and yes they’re in order of the likelihood I’d assign to them, completely unscientifically. I’ll take credit for whichever one comes to pass 😉
1. The 1994 – A flattish, low volatility market in 2014 as the two opposing forces of reduced stimulus and slightly better-than-expected economic growth fight each other to a draw. Stocks go nowhere in the end with little gyration to speak of. Incidentally, this would be the outcome that frustrates the most players – all the passive index johnny-come-lately’s who require a rising tide don’t get it, all the long/short hedge funds and vol-starved traders don’t get their desert oasis in this scenario either. Bear in mind that many of us are beginning to use 1994 as our analog here and for good reason – it’s a mid-bull market year shortly after recession with a pickup in earnings but with interest rates beginning to rise as well. In ’94, you got 20% growth in S&P earnings but a flat market because rising rates led to a 25% compression in PE multiples. That particular rate hike cycle involved the Fed Funds Rate rising 300 basis points and it took place over 14 months. Once it was completed, in early 1995, the S&P 500 was off to the races for the next five years. I wouldn’t fall out of my chair if we went through something similar now as rates normalize and stocks digest huge gains. Consolidation is terrific and I certainly would much prefer to correct through time rather than through price any day of the week.
2. A highly dynamic, binary year in which the first half is a continuation of the trends of 2013 followed by a nasty inflection point in the China debt bubble or interest rates. The gains of the first two quarters would be reversed in this scenario and sentiment would shift significantly. This would represent the best of all worlds for the global macro guys we’re all pelting with rotten tomatoes lately and would probably staunch the outflows from the bond kings (can you believe PIMCO Total Return lost $41 billion in AUM last year?!?).
3. The cyclical bull market crescendo – another monster year, corporate CapEx kicks in, an actual labor shortage begins, speculation gets even more egregious and even commodities get in on the act. The Fed finds itself behind the curve while global stocks, energy costs, worker wages, asset prices, corporate revenues and the velocity of money skyrocket. It would be interesting to see stocks and gold race higher against each other in a high-stakes game of chicken as everyone, all at once, seeks to protect themselves from and take advantage of the new boom. This particular scenario will feel really good for awhile but will undoubtedly speed up the end of the current cycle and bring about the next shitshow.
4. Something totally unexpected – weather event, country revolution, terror attack, breakthrough invention – renders everything we are basing our assumptions on today completely and utterly moot. Happens all the time, so stay loose.
Part III: Bottom line:
* US stocks are no longer cheap but they are not absurdly overvalued either.
* Stocks are still a better intermediate-term bet than bonds or cash under pretty much any imaginable scenario save for a crash.
* Sentiment is extremely positive but history tells us that it can remain that way for stretches of years before rolling over. Go ask traders who’ve been fading sentiment extremes during the last few years about this, if you can find them in the trauma ward and remove their feeding tubes.
* If true global economic growth kicks in, forward-looking valuation measures may prove to be cheaper than they appear today. Revenue growth and corporate CapEx spending, combined with the roll-off of fiscal austerity could give us a brand new leg higher. This is a big If and it requires a lot going right overseas, particularly in China and Europe.
* Human nature is on our side and animal spirits are back. It is very rare to see them appear and then stop on a dime once they’ve arrive.
* It is entirely possible that we’re on the precipice of the next great age of global growth fueled by a rejuvenated sense of ambition and a rebound in large-scale investment. There’s certainly enough liquidity to fuel it, but end-demand is the only key that can unlock the door. It is too early to say whether or not this kind of pent-up end-demand, on a global basis, will show up in time.
You are here.
And while it is hard to foresee what will happen next, we can certainly think strategically about how we’d want to be prepared for what could be coming.


[…] broker should put their energy into ensuring your current employee benefits plan runs as smoothly as […]
[…] You Are Here – The Reformed Broker […]
[…] “You are Here” is an article by The Reformed Broker, frequent CNBC commentator Josh Brown. It’s an overview of where we are in the market and what 2014 might hold in store. If you don’t read any other links today, read Josh, he’s an investment advisor who pulls no punches, using phrases such as “Thank god there was no f***ing Twitter back then.” With all the talking heads on TV shouting this or that, Josh appears the voice of reason, expletives aside. […]
… [Trackback]
[…] Information on that Topic: thereformedbroker.com/2014/01/05/you-are-here-2/ […]
… [Trackback]
[…] Read More Information here on that Topic: thereformedbroker.com/2014/01/05/you-are-here-2/ […]
… [Trackback]
[…] Information on that Topic: thereformedbroker.com/2014/01/05/you-are-here-2/ […]
… [Trackback]
[…] Information on that Topic: thereformedbroker.com/2014/01/05/you-are-here-2/ […]
… [Trackback]
[…] Read More on that Topic: thereformedbroker.com/2014/01/05/you-are-here-2/ […]
… [Trackback]
[…] Find More on that Topic: thereformedbroker.com/2014/01/05/you-are-here-2/ […]
… [Trackback]
[…] Read More Information here to that Topic: thereformedbroker.com/2014/01/05/you-are-here-2/ […]
… [Trackback]
[…] There you can find 73076 more Information on that Topic: thereformedbroker.com/2014/01/05/you-are-here-2/ […]
… [Trackback]
[…] There you will find 77407 more Information on that Topic: thereformedbroker.com/2014/01/05/you-are-here-2/ […]
… [Trackback]
[…] Information to that Topic: thereformedbroker.com/2014/01/05/you-are-here-2/ […]
… [Trackback]
[…] Information on that Topic: thereformedbroker.com/2014/01/05/you-are-here-2/ […]