I don’t link to or post those masturbatory charts that overlay one disparate market or index atop another anymore.
I’ve always found them to be bullshit and they have usually been used in an attempt to call a market top or to frighten people into thinking they’re stumbling into a horrific situation they’ve already been though. I’ve almost never seen one that was constructed with anything positive in mind.
The other day, I lay in a field with my three year old and I was pointing out shapes in the clouds as they drifted by. “That one looks like an elephant,” I told him, “and hey look, it’s a car!” He’s three years old and cannot read or write yet, but I’m fairly certain he doesn’t see those shapes I’m showing him and believe that they are actually elephants and cars.
I’m fine with pattern-recognition and I do agree that human behavior manifests itself during panics and manias in similar ways – but let’s keep it real, I could search through thousands of charts and find matches between almost any asset classes or indexes or stocks or commodities you could think of – but that doesn’t dictate what will happen next, it merely represents a possibility.
Big deal, I can list for you a million possibilities for the future – we’d be here all day.
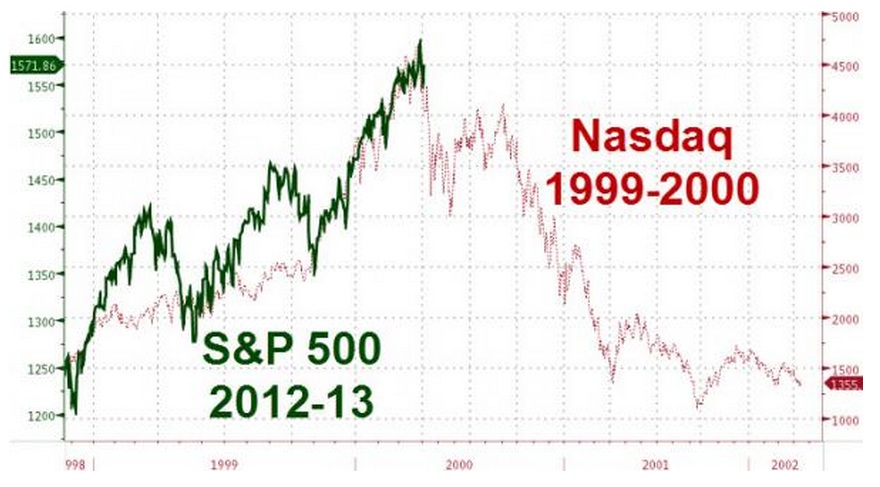
Here’s a particularly egregious example of someone making a chart say what they want it to say, via Joe Taxpayer:
Click to enlarge
The graph is intended to draw a similarity between the current S&P run-up and the Nasdaq run-up and ensuing crash. A scary coincidence that makes you want to sell right now? Or someone who’s fairly adept with charts pulling a visual fraud?
Have you caught the Big Lie yet? You see, the move from 1250 to near 1600 on the S&P is about 28%. In comparison, the Nasdaq move took it from about 1500 to 4500, a 200% increase. You can easily take any move in the market and with a bit of manipulation, create a chart as you see above. The key in this case is the two different scales, the S&P on the left, Nasdaq on the right. Had the charts been produced using the same scale, they’d show no resemblance to each other.
This scaling “lie” is just one way these charts deceive and confuse. Be aware.
[…] Brown provides us with an illustration of this error in action on his Reformed Broker blog post, “Lying with Charts.” (Strong language alert.)Fruity Scales A popular mind-game trick is to write a color but depict […]
I’m a New York City-based financial advisor at Ritholtz Wealth Management LLC. I help people invest and manage portfolios for them. For disclosure information please see here.
Subscribe & Reform
Get a Full Investor Curriculum: Join The Book List
Every month you'll receive 3-4 book suggestions--chosen by hand from more than 1,000 books. You'll also receive an extensive curriculum (books, articles, papers, videos) in PDF form right away.


[…] Brown provides us with an illustration of this error in action on his Reformed Broker blog post, “Lying with Charts.” (Strong language alert.)Fruity Scales A popular mind-game trick is to write a color but depict […]
… [Trackback]
[…] Find More on that Topic: thereformedbroker.com/2013/05/03/lying-with-charts/ […]
… [Trackback]
[…] Find More here to that Topic: thereformedbroker.com/2013/05/03/lying-with-charts/ […]
… [Trackback]
[…] Info to that Topic: thereformedbroker.com/2013/05/03/lying-with-charts/ […]
… [Trackback]
[…] Find More on on that Topic: thereformedbroker.com/2013/05/03/lying-with-charts/ […]
… [Trackback]
[…] Info to that Topic: thereformedbroker.com/2013/05/03/lying-with-charts/ […]
… [Trackback]
[…] There you can find 74469 additional Information to that Topic: thereformedbroker.com/2013/05/03/lying-with-charts/ […]
… [Trackback]
[…] Find More here to that Topic: thereformedbroker.com/2013/05/03/lying-with-charts/ […]
… [Trackback]
[…] Here you will find 57358 more Information to that Topic: thereformedbroker.com/2013/05/03/lying-with-charts/ […]
… [Trackback]
[…] Read More Information here on that Topic: thereformedbroker.com/2013/05/03/lying-with-charts/ […]
… [Trackback]
[…] Find More Info here to that Topic: thereformedbroker.com/2013/05/03/lying-with-charts/ […]
… [Trackback]
[…] Find More here to that Topic: thereformedbroker.com/2013/05/03/lying-with-charts/ […]