
The S&P 500 is now “officially in correction territory” I’ve been told by the TV. Good to know, although for many stocks the bear market started a year ago – especially the kind of stocks your nephew in college began trading during the pandemic. But now it’s the real thing – index-level correction. Apple, Microsoft, Home Depot’s down 120 points from its high, BlackRock’s down 200 points. The declines in these important stocks were not caused by a change in the fundamentals. They’ve been caused by the investor class’s perception of the near-term outlook for stocks generally. And some mechanical market stuff, like program trading and options market making, etc.
Last night’s opening salvo of rocket and missile strikes sent S&P 500 futures plunging and the prices of commodities skyrocketing. Stocks are falling around the world as crude takes out $100 a barrel, natural gas prices explode higher in spot markets from the US to Europe and the Fed’s job becomes significantly more difficult. Here’s Goldman Sachs’s Jan Hatzius explaining why the rate hikes are still coming regardless of the onset of war – but the 50 basis point hike in March might be off the table:
“The current situation is different from past episodes when geopolitical events led the Fed to delay tightening or ease because inflation risk has created a stronger and more urgent reason for the Fed to tighten today than existed in past episodes…With some signs of problematic wage-price dynamics emerging and near-term inflation expectations already high, further increases in commodity prices might be more worrisome than usual. As a result, we do not expect geopolitical risk to stop the FOMC from hiking steadily by 25bp at its upcoming meetings, though we do think that geopolitical uncertainty further lowers the odds of a 50bp hike in March.”
Sounds about right.
Now, everything I’ve just mentioned is completely out of your control. There’s nothing you can do about it. You can’t stop it. You can’t manage it. And I promise you that regardless of what happens with your portfolio this week, month, quarter, you wouldn’t trade places with a family living in Kyiv who may have to send a son or a father off to fight. Who may have to scramble to prepare a household for food and energy shortages in the coming days. So a little perspective may be in order.
In moments like these, and there have been dozens of them throughout the course of my career, I spend my time reminding people that the only answer is to focus on the things they can control. These things include their own reaction. Keeping their savings rate where it is. Maintaining the disciplined investment strategy they’ve already got in place. Staying calm. Thinking in terms of opportunity tomorrow as opposed to volatility today. It works, but you have to make it work. It takes effort to do this. Experience helps. Temperament helps. Having the rules established in advance helps. This type of market is precisely why we utilize tactical asset management alongside strategic asset allocation. Both are necessary.
I wrote this post two weeks before the market bottomed in March 2020 during the onset of coronavirus. It all still applies. Go back and read it again: I’m here to remind you
If it helped you then, it will help you now.
Lastly, I want to end on a hopeful note, with a little bit of help from one of my favorite strategists on Wall Street, BMO’s Brian Belski. Here’s what he put out to clients this morning:
A Market Correction Has Been Long Overdue
The S&P 500 has exhibited a price correction every 362 calendar days, on average, or approximately one year.
It has been nearly 22 months since the index last experienced a correction, making a 10% drawdown long overdue based on history.
Most Corrections Do Not Morph Into Bear Markets
We identified 29 S&P 500 price corrections going back to 1970. The peak-to-trough decline exceeded 20% just seven times, while the index avoided a bear market during the other 22 periods.
Duration of Corrections May Vary, but on Average Lasts Less Than Four Months
The average S&P 500 correction lasts 110 calendar days or just under four months with the longest being 531 days and shortest only 13 days.
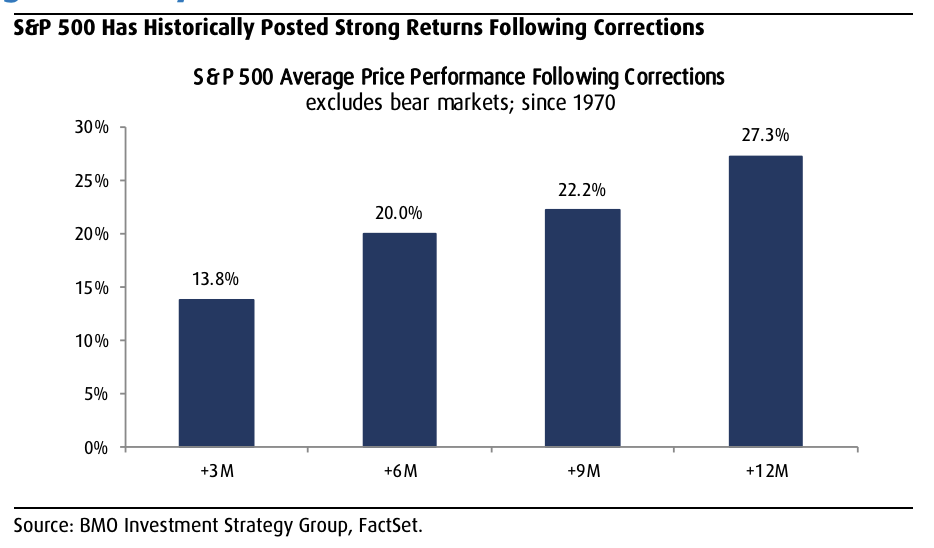
S&P 500 Performance Can Rebound Following Drawdown Periods
Following the end of non-bear market price corrections, the S&P 500 index has rebounded 13.8%, on average, in the subsequent three-month period and logged an average gain of 22.2% in the subsequent nine months.
Source:
US Strategy Snapshot: Correction and Conflict Combo Finally Testing the Bull
BMO Capital Markets – February 23rd, 2022
Josh here – it’s tempting to think this time might be different. And sure, some aspects of it will be. But people are still people. And the way they’ve gotten over past crises will be the way they get over current crises and future crises. These things slowly discount themselves into the consensus and then, eventually, become part of the backdrop rather than the driving force of each day’s market activity. We have a short attention span. We adapt. We get through it.
Brian’s chart is the reality of what comes next. Until then, focus on what you can control.


[…] Focus on what you can control (TRB) […]
[…] Source link […]
[…] Source link […]
[…] Concentrati su cosa puoi controllare pt 1 […]
[…] Source link […]
[…] Control what you can and ignore the rest. (thereformedbroker.com) […]