The S&P 500 is mostly concerned with duration (chart)

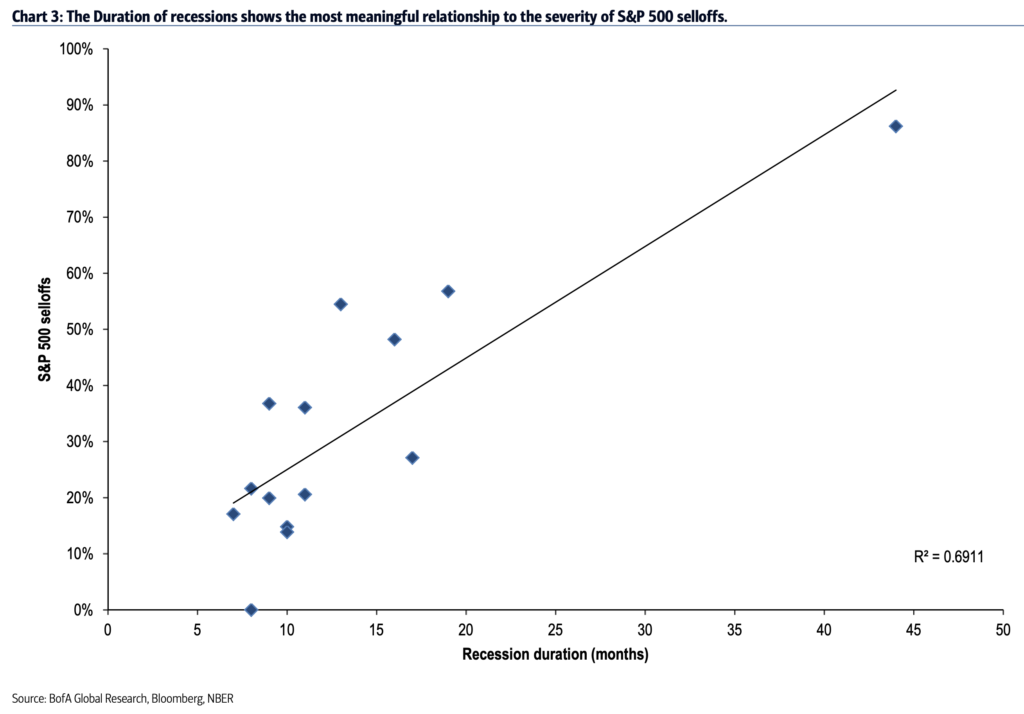
Building on my post from the other day, ‘Not Depth…Duration’, I want to show you something from this morning’s Bank of America Merrill Lynch Chart Blast – it shows a very correlation between how bad the drawdowns for the S&P 500 are versus the amount of months a recession goes on for. The longer the recession, the worse the stock market’s trough. In other words, the eye-popping “30 PERCENT DECLINE IN GDP” stuff is missing the point. It’s not how bad things get at their worst, it’s for how long it goes on for that the stock market usually reacts to. BofA looked at recessions going back to 1928 to create this chart:

Recession duration vs S&P 500 selloffs Recession duration provided the strongest indication of how sharp S&P 500 selloffs would be with a 0.69 R squared. In discussing the eventual recovery, The BofA economics team notes that ultimately, what level activity returns to depends critically on the response of confidence and demand, and the effectiveness of macro stimulus. Indeed, the longer the shutdown, the deeper the wounds that need to heal before confidence fully returns. Our work shows this view on the impact of duration of contraction is generally true, beyond the scope of the pandemic.

Source:

Sizing up recessions: The extent of contraction and market corrections
Bank of America Merrill Lynch – April 7th, 2020

Read Also:

Not Depth…Duration (TRB)

This content, which contains security-related opinions and/or information, is provided for informational purposes only and should not be relied upon in any manner as professional advice, or an endorsement of any practices, products or services. There can be no guarantees or assurances that the views expressed here will be applicable for any particular facts or circumstances, and should not be relied upon in any manner. You should consult your own advisers as to legal, business, tax, and other related matters concerning any investment.

The commentary in this “post” (including any related blog, podcasts, videos, and social media) reflects the personal opinions, viewpoints, and analyses of the Ritholtz Wealth Management employees providing such comments, and should not be regarded the views of Ritholtz Wealth Management LLC. or its respective affiliates or as a description of advisory services provided by Ritholtz Wealth Management or performance returns of any Ritholtz Wealth Management Investments client.

References to any securities or digital assets, or performance data, are for illustrative purposes only and do not constitute an investment recommendation or offer to provide investment advisory services. Charts and graphs provided within are for informational purposes solely and should not be relied upon when making any investment decision. Past performance is not indicative of future results. The content speaks only as of the date indicated. Any projections, estimates, forecasts, targets, prospects, and/or opinions expressed in these materials are subject to change without notice and may differ or be contrary to opinions expressed by others.

Wealthcast Media, an affiliate of Ritholtz Wealth Management, receives payment from various entities for advertisements in affiliated podcasts, blogs and emails. Inclusion of such advertisements does not constitute or imply endorsement, sponsorship or recommendation thereof, or any affiliation therewith, by the Content Creator or by Ritholtz Wealth Management or any of its employees. Investments in securities involve the risk of loss. For additional advertisement disclaimers see here: https://www.ritholtzwealth.com/advertising-disclaimers

Please see disclosures here.

What's been said:

Discussions found on the web
  1. w88 commented on Sep 21

    … [Trackback]

    […] Read More here to that Topic: thereformedbroker.com/2020/04/07/the-sp-500-is-mostly-concerned-with-duration-chart/ […]

  2. Alex Webcams commented on Oct 07

    … [Trackback]

    […] Here you will find 80643 more Information to that Topic: thereformedbroker.com/2020/04/07/the-sp-500-is-mostly-concerned-with-duration-chart/ […]

  3. cc shop online commented on Oct 31

    … [Trackback]

    […] There you can find 8962 more Information to that Topic: thereformedbroker.com/2020/04/07/the-sp-500-is-mostly-concerned-with-duration-chart/ […]

  4. Digital Transformation companies in USA commented on Nov 27

    … [Trackback]

    […] Find More Info here on that Topic: thereformedbroker.com/2020/04/07/the-sp-500-is-mostly-concerned-with-duration-chart/ […]

  5. wigs commented on Dec 17

    … [Trackback]

    […] Find More Info here to that Topic: thereformedbroker.com/2020/04/07/the-sp-500-is-mostly-concerned-with-duration-chart/ […]

  6. online dumps shop commented on Dec 23

    … [Trackback]

    […] Read More on that Topic: thereformedbroker.com/2020/04/07/the-sp-500-is-mostly-concerned-with-duration-chart/ […]

  7. on top replica commented on Jan 14

    … [Trackback]

    […] Information on that Topic: thereformedbroker.com/2020/04/07/the-sp-500-is-mostly-concerned-with-duration-chart/ […]

  8. DevSecOps commented on Jan 17

    … [Trackback]

    […] Information on that Topic: thereformedbroker.com/2020/04/07/the-sp-500-is-mostly-concerned-with-duration-chart/ […]

  9. CDA Fridge-freezers manuals commented on Jan 24

    … [Trackback]

    […] Read More Info here on that Topic: thereformedbroker.com/2020/04/07/the-sp-500-is-mostly-concerned-with-duration-chart/ […]