
Year three of the Trump presidency and there is no wall on the border. There is no fence and there is no physical barrier. And Mexico hasn’t spent any pesos on its future construction, nor has Congress.
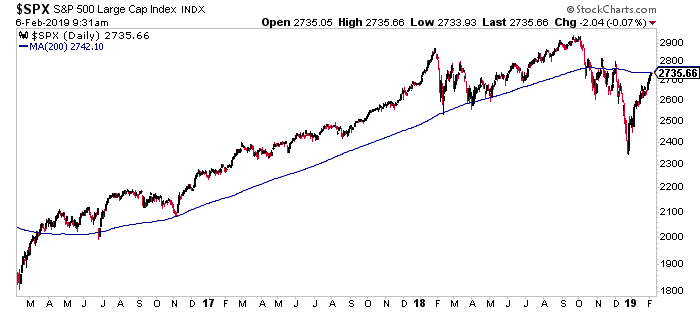
Similarly, talk of the S&P 500 bumping up against its 200-day moving average creates the impression that this overlay represents some sort of meaningful barrier or obstacle to the stock market. It does not. The 200-day moving average is neither wall, nor fence, nor physical barrier. It’s just an average price at which the index has closed over the last 200 sessions, roughly equal to ten months worth of activity.
I want to spend a moment teasing out what matters and what doesn’t when it comes to this topic.
The first thing you should know is that whether or not the S&P 500 is above or below the 200-day moving average doesn’t guarantee any particular course of action over the next 1 day, 10 days or two years. There’s no signal there, for if there was, everyone would know exactly what to do upon each cross to the upside or downside.
Second, you can see the market get above the 200-day moving average but do so while the market is still in a downtrend. Or, conversely, you can see the S&P 500 break below the 200-day while it’s still in an uptrend, with a positive slope. Traders who use technicals will be more concerned about the direction of the stock market – the trend – than they will be about some arbitrary average formed over hundreds of days.
There are traders who will use the use 200-day as a signal of bullish or bearishness and they’ll frequently compare it to either a shorter-term time frame (the 50-day, the 10-day) but the shorter the moving average, the more noisy it will be.
There is also something called the exponential moving average, which puts more emphasis on recent activity by more heavily weighting the nearer-term daily closes. But for most people, when they say “the 200-day” they’re referring to the simple, not the exponential.
Another thing worth bringing up is that there are a lot of tourists in this discussion – people without any real knowledge or experience in technical analysis, but a working understanding of how to throw an overlay on a chart. The commentary from these people is not analysis, nor is it helpful.
There is no worthwhile system that will produce satisfactory results from buying above the 200-day and then selling on a cross below, but there is one simple truth about market behavior above and below this imaginary line: Bad things tend to happen more often when the stock market is below. This seems obvious, and it is. When stocks are selling below the levels at which they’ve spent most of a year, people are more nervous and prone to reacting negatively. Volatility, on average, will be elevated when the S&P 500 is spending time below the 200-day, and the major corrections and crashes throughout history have almost all begun from underneath.
As Michael wrote in 2015:
When bad things have happened, they tended to do so below the 200-day. Since 1960, 22 of the 25 worst days have occurred below the 200-day moving average. Of the 100 worst single days over the last 55 years, 83 of them happened while stocks were below the 200-day.
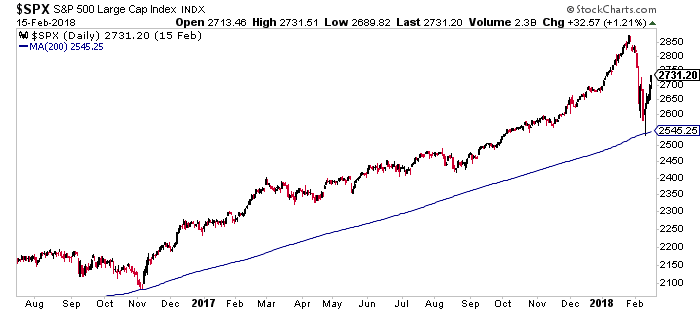
When a market spends a considerable amount of time above the 200-day and rarely presses down on it, volatility is dampened and market participants are less nervous as a result. The most recent period to think about would be the summer of 2016 through the winter of 2018, an incredibly smooth ride to the upside without much concern from anyone. You can see this period below:
The last thing I’ll say is that the line moves! Obvious, but important to point out. It is a train track that we are building while the train is running on it, and it reflects where we are and where we’ve been – it is not a window into the future. The 200-day moving average does a great job at describing our current situation and a lousy job describing what things will look like just around the bend. We cannot endlessly extrapolate a trend out into the future when it comes to stock prices because market participants are always worried or excited about tomorrow, and as their attitudes about the future change, the current prices of securities change with them.
We may break the 200-day moving average on the S&P 500 today or tomorrow. Or, we may hit that level and get turned away. Or, perhaps, we break above, get a lot of people excited and then see the breakout become a failed move, which really throws the sentiment of the crowd into a tumult. Each step of the way, there will be people assigning meaning to the meaningless, and signals to the randomness. I hope this explainer enables you to step back from the commentary and think for yourself – a fistful of salt at the ready for any commentary that appears too certain to be true.
Read also:
What You Need to Know About the 200-Day Moving Average (Michael Batnick)


[…] Similarly, talk of the S&P 500 bumping up against its 200-day moving average creates the impression that this overlay represents some sort of meaningful barrier or obstacle to the stock market. It does not. The … Source: https://thereformedbroker.com/2019/02/06/i-will-build-a-wall-at-the-200-day-moving-average/ […]
[…] ignore concerns over the 200-day moving average. He wrote a post on his blog this morning titled “I Will Build a Wall at the 200 Day Moving Average.” In the post, he acknowledges that the indicator is useful in identifying the trend and when […]
[…] the strategy even work? Josh Brown thinks not. “There’s no signal there, for if there was, everyone would know exactly what to do […]
[…] the strategy even work? Josh Brown thinks not. “There’s no signal there, for if there was, everyone would know exactly what to do upon each […]
… [Trackback]
[…] Read More on that Topic: thereformedbroker.com/2019/02/06/i-will-build-a-wall-at-the-200-day-moving-average/ […]
… [Trackback]
[…] Here you will find 37969 additional Information to that Topic: thereformedbroker.com/2019/02/06/i-will-build-a-wall-at-the-200-day-moving-average/ […]
… [Trackback]
[…] Read More Information here to that Topic: thereformedbroker.com/2019/02/06/i-will-build-a-wall-at-the-200-day-moving-average/ […]
… [Trackback]
[…] Find More Info here on that Topic: thereformedbroker.com/2019/02/06/i-will-build-a-wall-at-the-200-day-moving-average/ […]
… [Trackback]
[…] Read More to that Topic: thereformedbroker.com/2019/02/06/i-will-build-a-wall-at-the-200-day-moving-average/ […]
… [Trackback]
[…] Read More on that Topic: thereformedbroker.com/2019/02/06/i-will-build-a-wall-at-the-200-day-moving-average/ […]
… [Trackback]
[…] Information to that Topic: thereformedbroker.com/2019/02/06/i-will-build-a-wall-at-the-200-day-moving-average/ […]