
Jon Krinsky at MKM Partners shares an amazing stat on the S&P 500’s recent proximity to the all-time highs:
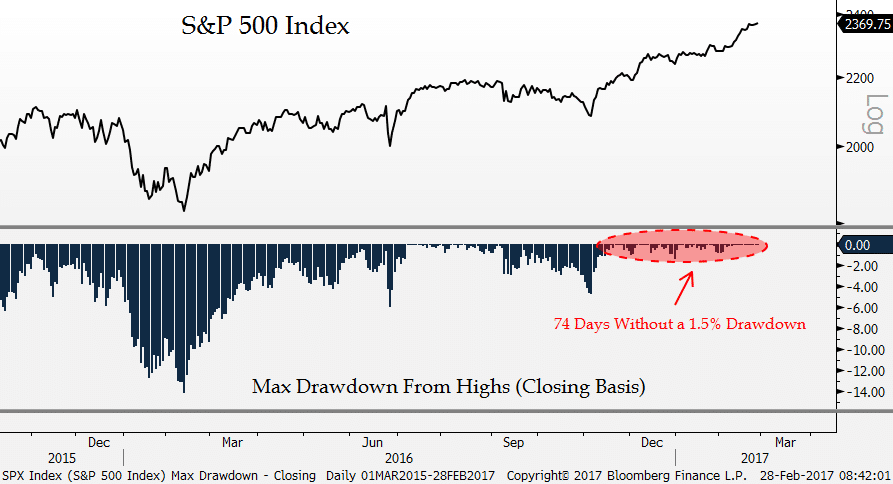
By now, most participants are aware that the S&P 500 hasn’t had a 1% down day since October 12th, or 94 consecutive trading days. That ties the streak from 2006. Barring a 1% down day today, this will be the longest such streak since 1995. Yet in many ways, a single 1% down day is irrelevant. For instance, two consecutive down days of 0.90% would be a much bigger drawdown than a single 1% down day. To get a better view of impact to a portfolio, we looked at the maximum SPX drawdown from a 52-week high (closing basis) going back to 1960.
Remarkably, the SPX has gone 74 trading days without a 1.5% drawdown from the 52-week high. That is the longest such streak since 1964 (126 trading days), and the second longest streak since 1960. Recently there was a streak of 72 days that ended on 7/30/14, and there was also a streak that ended at 72 days on 5/17/95. Outside of those, there was a 60 day streak that ended almost exactly ten years ago on 2/26/07.
Jon’s takeaway is the right one – vol cannot be contained forever, but the length of time that could pass before it comes back can and will amaze even veteran traders.
Source:
74 days without a 1.5% drawdown… longest streak in 53 years
MKM Partners – February 28th 2017


… [Trackback]
[…] Find More Information here on that Topic: thereformedbroker.com/2017/03/01/chart-o-the-day-longest-streak-in-53-years/ […]
… [Trackback]
[…] Information to that Topic: thereformedbroker.com/2017/03/01/chart-o-the-day-longest-streak-in-53-years/ […]
… [Trackback]
[…] Read More on to that Topic: thereformedbroker.com/2017/03/01/chart-o-the-day-longest-streak-in-53-years/ […]