
Earlier this morning we looked at the remarkable turnaround in emerging market fund flows, which went positive for the first time in 13 weeks.
Below, a chart from Michael Hartnett’s BAML Flow Show report of the year-to-date scorecard for all equity regional categories. One grain of salt – last week also happened to be the first week of the 4th quarter, which means there’s definitely some rebalancing activity happening here – especially given the fact we’re talking about mutual funds and ETFs.
Equity Flows
Japan cracks: $1.6bn outflows (biggest 3w outflows since Nov’14)
EM is back: first inflows in 14 weeks ($0.7bn)
Europe defiant: $3.1bn inflows (inflows in 20 out of past 22 weeks)
US: muted $0.7bn inflows ($2.8bn ETF inflows vs $2.0bn mutual fund outflows)
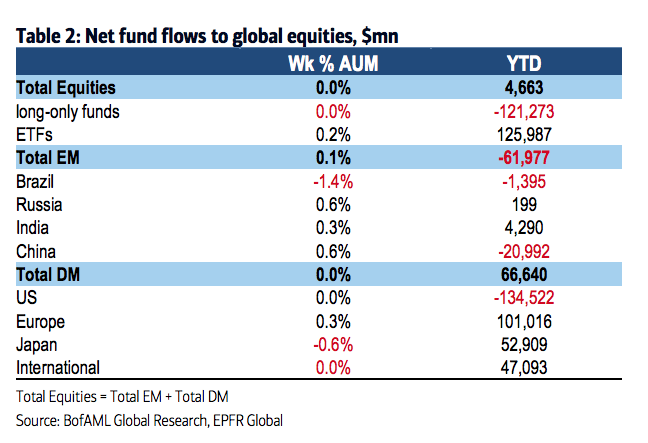
Josh here – that year-to-date negative $121 billion number from long only equity mutual funds is unbelievable! And the nearly mirror image replacement into ETFs just below it! I predicted this three years ago (see: The end of mutual funds is coming – Fortune) but I’m still shocked to see it.
Source:
Go Ahead Junk…Make My Day
Bank of America Merrill Lynch – October 15th 2015


RT @ReformedBroker: Year-to-date:
$121 billion out of stock mutual funds
$125 billion into stock ETFs
http://t.co/8T4zUno2xO http://t.co…
RT @ReformedBroker: Year-to-date:
$121 billion out of stock mutual funds
$125 billion into stock ETFs
http://t.co/8T4zUno2xO http://t.co…
RT @ReformedBroker: Year-to-date:
$121 billion out of stock mutual funds
$125 billion into stock ETFs
http://t.co/8T4zUno2xO http://t.co…
RT @ReformedBroker: Year-to-date:
$121 billion out of stock mutual funds
$125 billion into stock ETFs
http://t.co/8T4zUno2xO http://t.co…
RT @ReformedBroker: Year-to-date:
$121 billion out of stock mutual funds
$125 billion into stock ETFs
http://t.co/8T4zUno2xO http://t.co…
RT @ReformedBroker: Year-to-date:
$121 billion out of stock mutual funds
$125 billion into stock ETFs
http://t.co/8T4zUno2xO http://t.co…
RT @ReformedBroker: Year-to-date:
$121 billion out of stock mutual funds
$125 billion into stock ETFs
http://t.co/8T4zUno2xO http://t.co…
RT @ReformedBroker: Year-to-date:
$121 billion out of stock mutual funds
$125 billion into stock ETFs
http://t.co/8T4zUno2xO http://t.co…
RT @ReformedBroker: Year-to-date:
$121 billion out of stock mutual funds
$125 billion into stock ETFs
http://t.co/8T4zUno2xO http://t.co…
El fin de los #fondosdeinversion ? Chart o’ the Day: Global Equity Fund Flow Scorecard http://t.co/r1fxnfSMnT
RT @asibiza1: “The great market rebalancing…” @ReformedBroker http://t.co/8s9tUe514P
RT @ReformedBroker: Year-to-date:
$121 billion out of stock mutual funds
$125 billion into stock ETFs
http://t.co/8T4zUno2xO http://t.co…
… [Trackback]
[…] Info to that Topic: thereformedbroker.com/2015/10/16/chart-o-the-day-global-equity-fund-flow-scorecard/ […]
… [Trackback]
[…] Find More to that Topic: thereformedbroker.com/2015/10/16/chart-o-the-day-global-equity-fund-flow-scorecard/ […]
… [Trackback]
[…] Find More to that Topic: thereformedbroker.com/2015/10/16/chart-o-the-day-global-equity-fund-flow-scorecard/ […]