
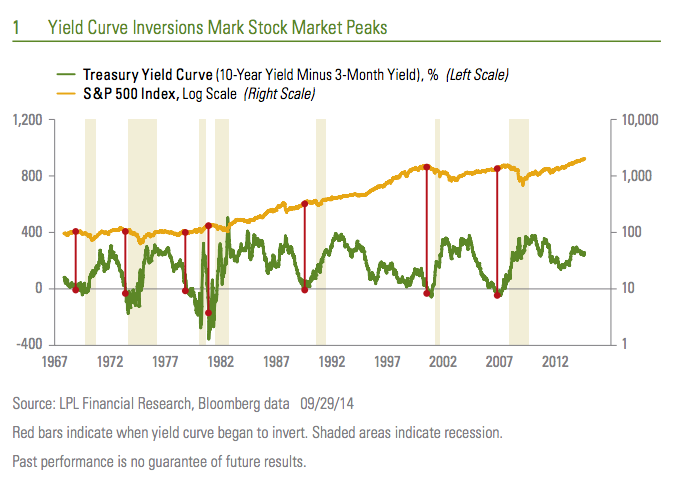
LPL Financial’s CIO, Burt White, has a very succinct piece of research about why the yield curve is one of the five most important indicators the firm keeps an eye on. He notes the fact that an inverted yield curve has a perfect record of forecasting recessions over the last half-century, although the timing is never precise…
Bull markets have ended and bear markets have begun when the Fed pushes short-term rates above long-term rates. This is referred to as an inverted yield curve. For example, the S&P 500 Index peaked in 2000 and 2007 when the yield curve inverted, with the three-month T-bill yield about 0.5% above the yield on the 10-year Treasury note.
Why does an inverted yield curve signal a major peak for the stock market? Because every recession over the past 50 years was preceded by the Fed hiking rates to slow inflation and/or an overheated economy enough to invert the yield curve [Figure 1]. That is seven out of seven times—a perfect forecasting track record. The yield curve inversion usually takes place about 12 months before the start of the recession, but the lead time ranges from about five to 16 months. The peak in the stock market comes around the time of the yield curve inversion, ahead of the recession and accompanying a downturn in corporate profits.
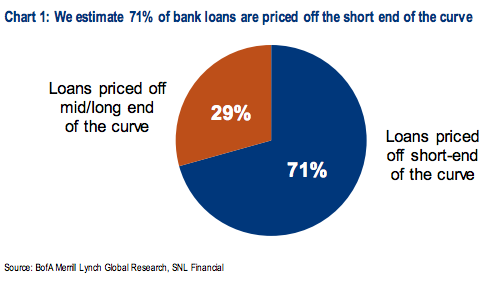
Josh here – the paradox here is that a rise in short-term rates would be absolutely outstanding. The bank stock strategists at Bank of America Merrill Lynch point out that 71% of the loans made by the US banks are based on short rates (Prime rate or LIBOR) and their earnings power would be juiced substantially from a slow, steady lift at that end of the curve.
On September 18th, Erika Najarian (no relation to the brothers) explained that short rates rising faster than long rates would be a big positive:
Higher short rates are the best scenario for bank earnings, and eventually, bank stocks – even if this means that the yield curve becomes somewhat flatter. The market is conditioned to buy bank stocks when the yield curve steepens.
However, for net interest margins to expand, banks actually need short rates to go up more than they need long rates to increase, given that most loans and earning assets are priced off the front of the curve. If margins expand, EPS estimates will likely go materially higher. And if estimates go higher, so should bank stocks. Beneficiaries under this scenario would be mega-cap banks and rate sensitive regionals. Among the latter, we prefer RF, SIVB, TCBI, and FCB.
Here’s her chart:
Josh here, again – We can thus square the circle by saying higher short rates would not be a negative – so long as they don’t get above long ones. This is not an imminent threat by any means, given where things stand currently. Which is why many economists have argued for a prolonged economic cycle.
Sources:
Grading on a Curve
LPL Financial – September 29th 2014
Bank playbook: Based on your view of interest rates
Bank of America Merrill Lynch – September 18th 2014


… [Trackback]
[…] Find More on that Topic: thereformedbroker.com/2014/10/02/why-the-yield-curve-matters/ […]
buy cialis doctor
SPA