Stocks are having a rough open this morning and the Nasdaq is leading the carnage. The tech component of the Nasdaq looks even worse.
Tech is important for the market. It’s the source of a lot of the dividend growth and earnings growth that investors are expecting. It’s one of the only areas capable of secular revenue growth in a time of global sluggishness. It’s comprised of the highest profile companies that are changing our world.
And it’s a massive weighting in the S&P 500.
There are other sectors within the NDX, like consumer discretionary and biotech, that also have many stocks breaking lower. But tech is still the big wheel.
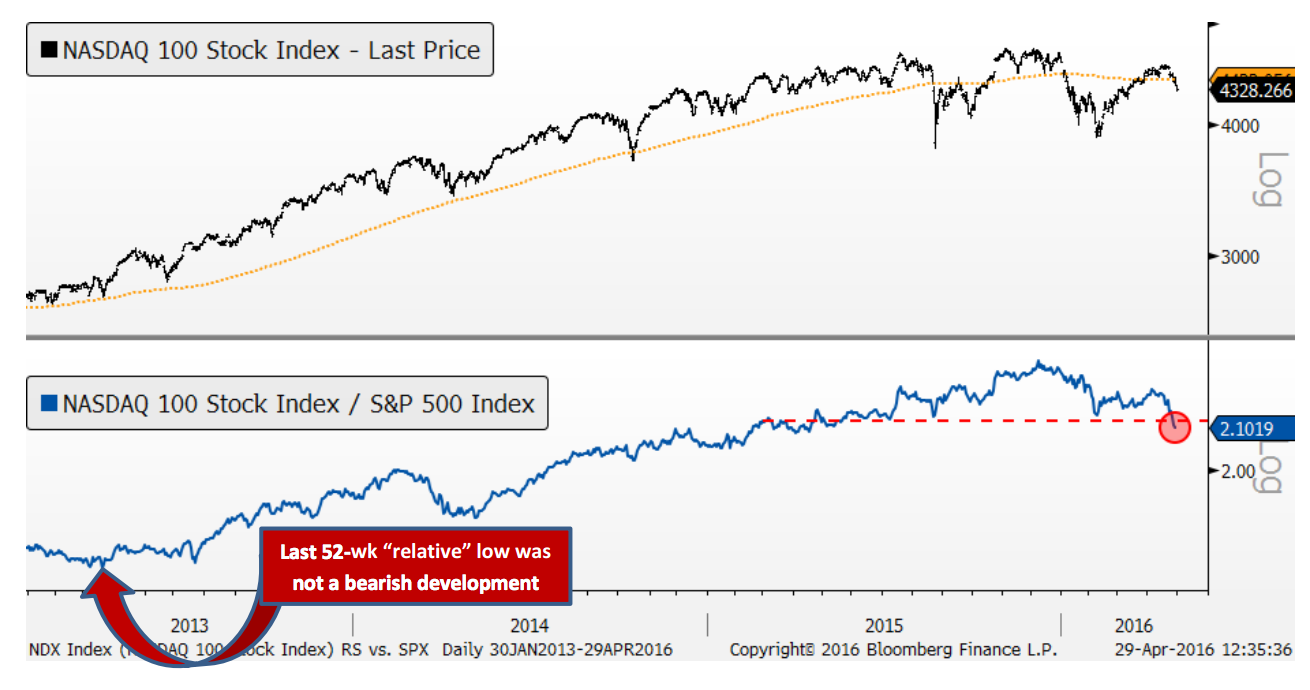
Jon Krinsky at MKM Partners points out the relative weakness in the NDX that’s begun to develop on the heels of some not-so-great earnings reports from the likes of Apple and Microsoft…
The ratio of the NDX vs. SPX hit a 52-week low last week, something it hasn’t done since 2013. Much of this can be attributed to the weakness in some marquee large-cap tech names (AAPL, GOOGL, MSFT, INTC). Those four represent ~30% of the NDX. Historically the implications of this relative weakness have not necessarily been bearish (spring 2013 for example), but given that these names have a big weighting on the SPX, further deterioration would clearly be a headwind for the overall market.
His chart here:
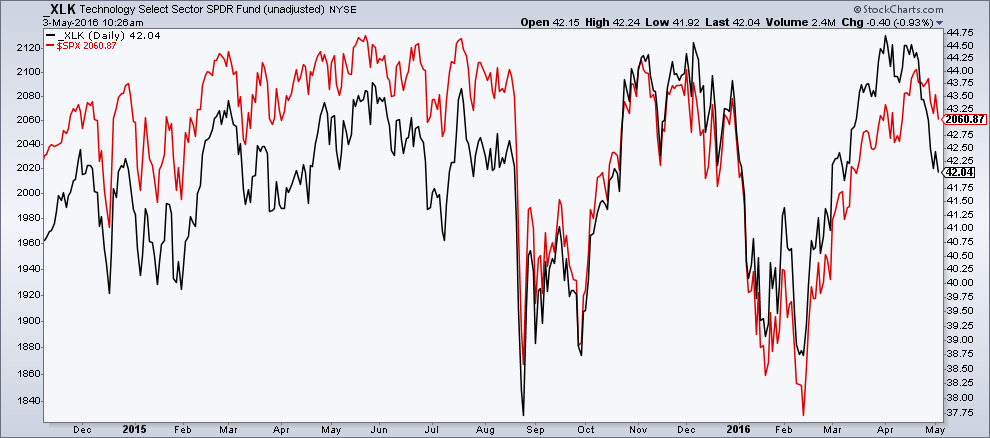
Josh here – what’s notable is that the SPX failed at the old highs just as tech the Nasdaq was weakening. In my chart below, you can see the XLK (S&P 500 tech sector ETF, price return) break south and take the SPX down with it:
Given how closely these two indices have traded over the last 18 months, it shouldn’t be surprising that market players are now worried about a catch-up leg down for the broad markets as tech slides further.
Source:
Back in the Neutral Zone MKM Partners – May 1st 2016
I’m a New York City-based financial advisor at Ritholtz Wealth Management LLC. I help people invest and manage portfolios for them. For disclosure information please see here.
Subscribe & Reform
Get a Full Investor Curriculum: Join The Book List
Every month you'll receive 3-4 book suggestions--chosen by hand from more than 1,000 books. You'll also receive an extensive curriculum (books, articles, papers, videos) in PDF form right away.


… [Trackback]
[…] Read More to that Topic: thereformedbroker.com/2016/05/03/chart-o-the-day-nasdaq-weakness-as-a-headwind/ […]
… [Trackback]
[…] Find More here on that Topic: thereformedbroker.com/2016/05/03/chart-o-the-day-nasdaq-weakness-as-a-headwind/ […]
… [Trackback]
[…] Find More Information here on that Topic: thereformedbroker.com/2016/05/03/chart-o-the-day-nasdaq-weakness-as-a-headwind/ […]
… [Trackback]
[…] Info to that Topic: thereformedbroker.com/2016/05/03/chart-o-the-day-nasdaq-weakness-as-a-headwind/ […]
… [Trackback]
[…] Read More Information here on that Topic: thereformedbroker.com/2016/05/03/chart-o-the-day-nasdaq-weakness-as-a-headwind/ […]
… [Trackback]
[…] Read More here to that Topic: thereformedbroker.com/2016/05/03/chart-o-the-day-nasdaq-weakness-as-a-headwind/ […]
… [Trackback]
[…] Find More on on that Topic: thereformedbroker.com/2016/05/03/chart-o-the-day-nasdaq-weakness-as-a-headwind/ […]
… [Trackback]
[…] Read More to that Topic: thereformedbroker.com/2016/05/03/chart-o-the-day-nasdaq-weakness-as-a-headwind/ […]