Chart o’ the Day: Fun with Correlations

State Street SPDRs is out with some cool charts showing the very high correlations between two thematic issues of the day and their sector ETFs…

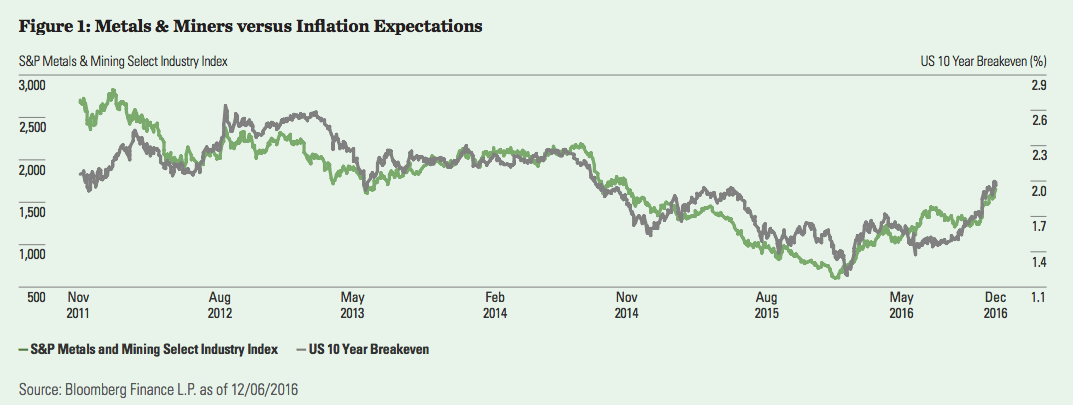
Take a look at the relatively small Metals & Miners index (the ETF is XME) versus inflation expectations:

Figure 1 shows the relationship between breakeven inflation rates and the S&P Metals & Mining Select Industry Index, which has a 0.94 beta1 to breakevens over the last five years — three times higher than the S&P 500 Index.

screen-shot-2017-01-19-at-10-52-38-am

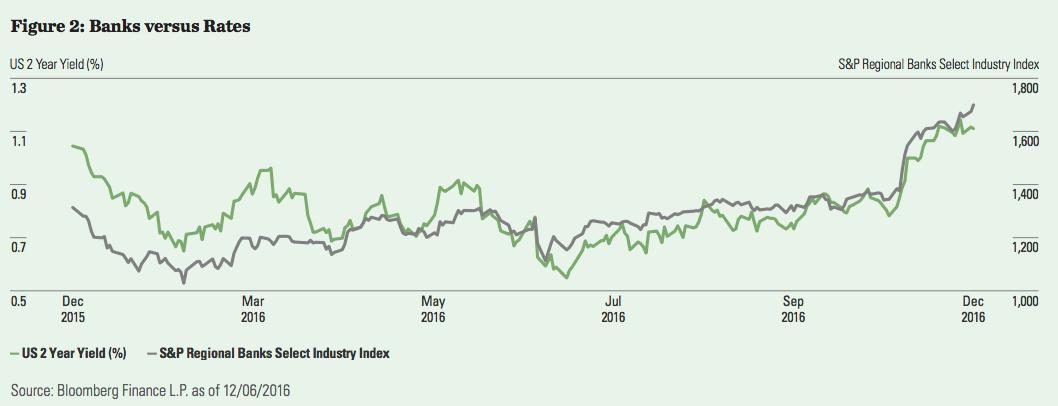
Here’s two-year Treasury yields (short-term rates) vs the popular regional banks index:

Higher interest rates may positively impact banks’ lending margins and the prices of regional banking stocks — an industry that has more of a lending focus than broader diversified banks. Figure 2 illustrates how regional banks have followed the path of the US 2 Year Yield, a rate that is most sensitive to Fed policy.

screen-shot-2017-01-19-at-10-52-52-am

Josh here – now, of course, these correlations can loosen and even break apart given the extenuating circumstances in which investors are always forced to live. Sometimes, a given sector or industry’s worth of stocks will over-price the potential of something happening, like rising rates or looser regulations. The overshoot could lead to pain for those who jump into a theme too late.

But for now, yes, these are powerful correlations that show no signs of deterioration.

Source:

Spotting Trends
State Street SPDRs – Q1 2017

This content, which contains security-related opinions and/or information, is provided for informational purposes only and should not be relied upon in any manner as professional advice, or an endorsement of any practices, products or services. There can be no guarantees or assurances that the views expressed here will be applicable for any particular facts or circumstances, and should not be relied upon in any manner. You should consult your own advisers as to legal, business, tax, and other related matters concerning any investment.

The commentary in this “post” (including any related blog, podcasts, videos, and social media) reflects the personal opinions, viewpoints, and analyses of the Ritholtz Wealth Management employees providing such comments, and should not be regarded the views of Ritholtz Wealth Management LLC. or its respective affiliates or as a description of advisory services provided by Ritholtz Wealth Management or performance returns of any Ritholtz Wealth Management Investments client.

References to any securities or digital assets, or performance data, are for illustrative purposes only and do not constitute an investment recommendation or offer to provide investment advisory services. Charts and graphs provided within are for informational purposes solely and should not be relied upon when making any investment decision. Past performance is not indicative of future results. The content speaks only as of the date indicated. Any projections, estimates, forecasts, targets, prospects, and/or opinions expressed in these materials are subject to change without notice and may differ or be contrary to opinions expressed by others.

Wealthcast Media, an affiliate of Ritholtz Wealth Management, receives payment from various entities for advertisements in affiliated podcasts, blogs and emails. Inclusion of such advertisements does not constitute or imply endorsement, sponsorship or recommendation thereof, or any affiliation therewith, by the Content Creator or by Ritholtz Wealth Management or any of its employees. Investments in securities involve the risk of loss. For additional advertisement disclaimers see here: https://www.ritholtzwealth.com/advertising-disclaimers

Please see disclosures here.

What's been said:

Discussions found on the web
  1. https://www.tomtop.su/ commented on Jan 16

    … [Trackback]

    […] Read More to that Topic: thereformedbroker.com/2017/01/19/chart-o-the-day-fun-with-correlations/ […]

  2. GE GTDX400GDWS manuals commented on Jan 21

    … [Trackback]

    […] Find More Information here to that Topic: thereformedbroker.com/2017/01/19/chart-o-the-day-fun-with-correlations/ […]