
I got the idea for this chart from Arthur Hill’s latest commentary about the larger trend for the S&P 500 (higher) being more important than the smaller trend (early September sell-off).
I find that the longer one’s time horizon is, the less susceptible he or she will be to the counter-trend noise that encourages so many ill-advised tactical misadventures among the hair-trigger set – “this is it!”
No, it’s not. Calm down.
Anyway, at this time of year, it’s impossible not to start thinking about the end. How do we finish? For sure, the election could produce all manner of volatility, in addition to the dicketry going on overseas at all times. But the bigger trend is higher, for now.
And besides, chasing will be a big part of how we finish up. In my view, career risk is now at an all-time high. The outflows from professional managers have turned into a tsunami this year. Just last week, a net $7.7 billion was pulled out of US stock mutual funds. That’s in a single week! Redemptions from hedge funds have been historic all year too.
And in the meantime, the major US averages are all more than 5% higher year-to-date. While the Fed just told us they’re on hold until at least December.
Putting these pieces together, my best guess is that a performance chase is more likely than not once again this fall. Charlie Munger talks about incentives being they key to almost everything and I agree. Keeping one’s employment in a high-paid job is the mother or all incentives, after, let’s say, life and sex.
So, the career risk trade is on. And the good news is, it can be charted. Allow me to introduce you to the R.O.C. indicator, or rate of change. In my chart below, I look at the S&P 500 index in the top pane and the percentage gains over the trailing 52 weeks in the bottom pane.
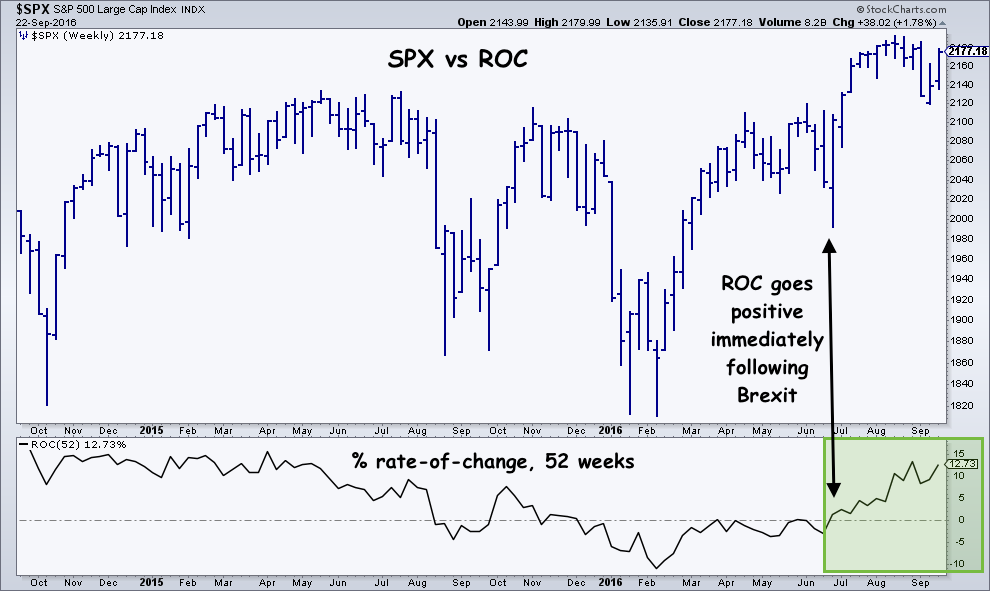
We’re now looking at a double-digit one-year return in the index that everyone is compared with (whether they deem it appropriate or not). And it’s trending up.
And this condition, like extended viewings of the Sean Hannity program, can drive a sane man crazy.
The S&P 500 is showing a 12% gain over this time last year, aided by the sell-off in the late summer of 2015 from the yuan devaluation. But there are no asterisks in this game. The numbers are the numbers.
Having a good answer to the question “How are we doing over the last year?” is a powerful motivator. You’re seeing it work it’s magic as we speak.


… [Trackback]
[…] Read More to that Topic: thereformedbroker.com/2016/09/23/charting-the-career-risk-trade-into-year-end/ […]
… [Trackback]
[…] Here you can find 14432 additional Info to that Topic: thereformedbroker.com/2016/09/23/charting-the-career-risk-trade-into-year-end/ […]
… [Trackback]
[…] Find More here on that Topic: thereformedbroker.com/2016/09/23/charting-the-career-risk-trade-into-year-end/ […]
… [Trackback]
[…] Read More on that Topic: thereformedbroker.com/2016/09/23/charting-the-career-risk-trade-into-year-end/ […]